


TIS_Awesome
$180.00
Awesome Oscillator de Bill Williams para NinjaTrader 8 con períodos Fast y Slow editables y señales saucer automáticas, listas para Markers y Strategy Builder.
Bill Williams' Awesome Oscillator for NinjaTrader 8 with editable Fast and Slow periods and automatic saucer signals, ready for Markers and Strategy Builder.
Descripción
TIS Awesome Oscillator para NinjaTrader 8
El histograma de momentum de Bill Williams con períodos editables y señales saucer automáticas, listas para Markers y Strategy Builder.
Qué hace
Dibuja el Awesome Oscillator, la distancia entre un promedio rápido y uno lento del precio medio de cada vela, y suma lo que la mayoría de las versiones deja librado al ojo: detecta el saucer, la pausa corta dentro de un movimiento, y marca la vela donde el momentum retoma. Esas señales se publican como series de datos propias, así que Markers y el Strategy Builder las pueden operar directamente.
Períodos Fast y Slow editables
Trae los clásicos 5 y 34 por defecto, pero los dos períodos son parámetros. Ajustá el oscilador a instrumentos más rápidos o más lentos, o dejá que el Strategy Analyzer los optimice.
Señales saucer automáticas
Los saucers de compra y de venta se detectan en cada vela. No hace falta encontrar a ojo una pausa de dos o tres columnas, que en temporalidades bajas se pasa fácil.
Color según la dirección
Cada columna es azul cuando sube y naranja cuando baja, sin importar su signo. Un histograma que sigue positivo pero se achica ya se lee como momentum que se agota, antes de cruzar el cero.
Listo para Markers y Strategy Builder
Los plots Longs y Shorts se pueden elegir como fuente de señal en Markers, en el Strategy Builder o desde tu propio código NinjaScript.
Gráfico limpio
Los puntos de señal van sobre el histograma y vienen transparentes por defecto, así el panel queda limpio. Si además querés verlos, asignales un color en la configuración del indicador.
Definitivo al cierre de vela
Todo se calcula al cierre de vela. Una vez cerrada la vela, su señal es definitiva y no cambia, así que lo que ves en un backtest es lo que la estrategia habría recibido.
Cómo funciona el saucer
El saucer es una lectura de continuación, no de reversión: el momentum hace una pausa de una vela sin cambiar de lado y después retoma. Eso lo separa de esperar un cruce del cero, que llega mucho más tarde.
Saucer de compra
El histograma está por encima de cero, la columna anterior bajó y la actual vuelve a subir. La señal se marca en la vela donde el momentum retoma hacia arriba.
Saucer de venta
El espejo: el histograma está por debajo de cero, la columna anterior subió y la actual vuelve a bajar.
Parámetros y salidas
| Nombre | Tipo | Descripción |
|---|---|---|
| Period Fast | Parámetro | Promedio rápido del precio medio. Por defecto 5. Valores más bajos reaccionan antes y generan más saucers. |
| Period Slow | Parámetro | Promedio lento del precio medio. Por defecto 34. La distancia entre los dos períodos define la escala del histograma. |
| Awesome Oscillator | Plot | El histograma: promedio rápido menos promedio lento. |
| Longs | Plot | Tiene valor solo en las velas con saucer de compra. |
| Shorts | Plot | Tiene valor solo en las velas con saucer de venta. |
Mejor con un filtro de tendencia
El saucer rinde como herramienta de timing de entrada. Que un indicador de tendencia decida el lado y el saucer decida la vela: en Markers combinás los dos como condiciones y las entradas de continuación se automatizan sin escribir código.
Requisitos
NinjaTrader 8. La licencia se entrega con la compra y se valida automáticamente al cargar el indicador. Si la licencia se activa con el gráfico ya abierto, recargá el gráfico con F5.
TIS Awesome Oscillator for NinjaTrader 8
Bill Williams’ momentum histogram with editable periods and automatic saucer signals, ready for Markers and Strategy Builder.
What it does
It plots the Awesome Oscillator, the distance between a fast and a slow average of each bar’s median price, and adds what most versions leave to the eye: it detects the saucer, the short pause inside a move, and marks the bar where momentum picks back up. Those signals are published as their own data series, so Markers and the Strategy Builder can trade them directly.
Editable Fast and Slow periods
The classic 5 and 34 come as defaults, but both periods are parameters. Retune the oscillator for faster or slower instruments, or let the Strategy Analyzer optimize them.
Automatic saucer signals
Long and short saucers are detected on every bar. No need to spot a two or three column pause by eye, which is easy to miss on lower timeframes.
Colored by direction
Each column is blue when it rises and orange when it falls, regardless of its sign. A histogram that is still positive but shrinking already reads as fading before it crosses zero.
Ready for Markers and Strategy Builder
The Longs and Shorts plots can be selected as signal sources in Markers, in the Strategy Builder or from your own NinjaScript code.
Clean chart
Signal dots sit on the histogram and are transparent by default, so the panel stays clean. Give them a color in the indicator settings if you also want to see them.
Final on bar close
Everything is calculated on bar close. Once a bar has closed, its signal is final and never changes, so what you see in a backtest is what the strategy would have received.
How the saucer works
The saucer is a continuation read, not a reversal one: momentum pauses for a bar without changing sides, and then resumes. That is what separates it from waiting for a zero cross, which arrives much later.
Long saucer
The histogram is above zero, the previous column fell and the current one rises again. The signal is placed on the bar where momentum turns back up.
Short saucer
The mirror image: the histogram is below zero, the previous column rose and the current one falls again.
Parameters and outputs
| Name | Type | Description |
|---|---|---|
| Period Fast | Parameter | Fast average of the median price. Default 5. Lower values react sooner and produce more saucers. |
| Period Slow | Parameter | Slow average of the median price. Default 34. The gap between both periods sets the scale of the histogram. |
| Awesome Oscillator | Plot | The histogram: fast average minus slow average. |
| Longs | Plot | Has a value only on bars with a long saucer. |
| Shorts | Plot | Has a value only on bars with a short saucer. |
Best used with a trend filter
The saucer shines as an entry timing tool. Let a trend indicator decide the side and let the saucer decide the bar: in Markers, combine both as conditions and the continuation entries can be automated without writing code.
Requirements
NinjaTrader 8. The license is delivered with your purchase and validated automatically when the indicator loads. If the license is activated while the chart is already open, reload the chart with F5.
Solo los clientes que hayan comprado este producto pueden dejar una opinión.
Productos relacionados
-
Popular
-


-
Oferta
¡Oferta!
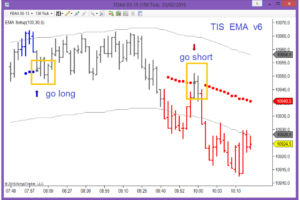
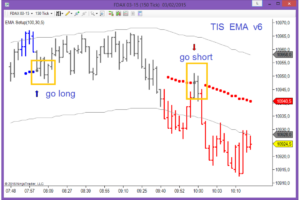
TIS_EMA_Trader
El precio original era: $210.00.$168.00El precio actual es: $168.00. -
Opiniones
Aún no hay opiniones.