

TIS_ADX_VMA
$180.00
Indicador de tendencia adaptativo que usa una media móvil variable (VMA) impulsada por lecturas ADX, generando señales direccionales basadas en la fuerza de pendiente.
Adaptive Trend Signals Based on ADX
Descripción
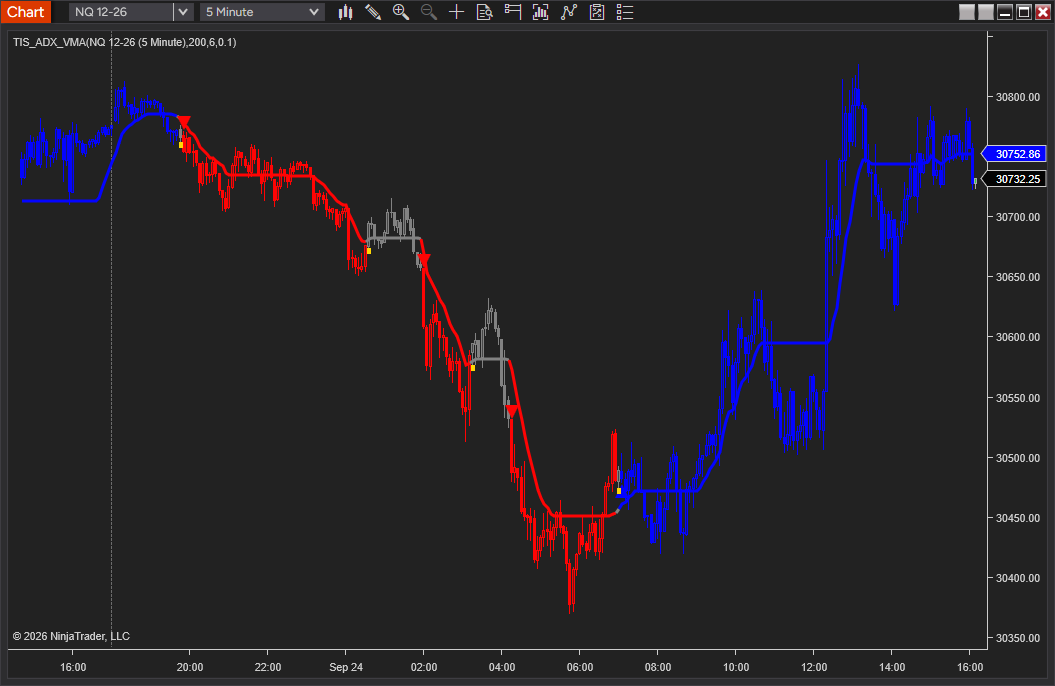
TIS_ADX_VMA para NinjaTrader 8 es una media móvil que cambia su propia velocidad según lo unidireccional que esté el mercado. Corre pegada al precio mientras el movimiento es limpio, y se aplana casi por completo cuando el mercado se pone lateral. La propia línea te dice en cuál de los dos estás.
Cómo Funciona
Detrás de la línea hay un índice direccional que mide cuánto del movimiento reciente fue en una sola dirección. Ese índice se compara contra su propio rango reciente. Cuando está cerca del techo de ese rango, el mercado se mueve con convicción y la media puede seguir al precio de cerca. Cuando se derrumba hacia el piso, la media se frena hasta quedar casi congelada. Por eso la línea deja de vagar durante las consolidaciones, en lugar de cortar el precio una y otra vez como hace una media de período fijo.
Encima de la media hay tres estados: alcista, bajista y neutro. El cambio de estado no lo dispara cualquier movimiento, sino uno mayor a una fracción del ATR actual. Esa fracción es el parámetro Sensibility, y como el umbral se mide en ATR y no en puntos, el mismo valor se comporta de forma consistente entre instrumentos y temporalidades.
El estado neutro es lo que una media común no te da. En vez de tener que leer cada cruce como largo o corto, tenés una tercera lectura explícita para cuando no hay nada, que además es la salida natural.
Hold Trend State decide qué tan firme es ese estado. Activado, que es como viene, la tendencia sobrevive a sus propias pausas: se mantiene aunque la media no avance lo suficiente en alguna vela, y solo cambia cuando se mueve más que el umbral en la dirección contraria. Desactivado se recupera el comportamiento histórico del indicador, donde el estado se recalcula desde cero en cada vela y cae a neutro apenas una vela no supera el umbral. En los dos modos la tendencia nunca salta de alcista a bajista de una vela a la otra: pasa por neutro, así que siempre hay una salida entre dos entradas opuestas.
Todo se evalúa al cierre de la vela. Una vez cerrada la vela, su estado y sus marcas son definitivos y no cambian nunca.
Características
▸ Media autoajustable: rápida mientras el movimiento es direccional, casi plana mientras el mercado lateraliza
▸ Tres estados explícitos, alcista, bajista y neutro, en lugar de una lectura binaria de arriba o abajo
▸ Umbral de cambio medido en ATR, para que un mismo valor sirva en distintos instrumentos y temporalidades
▸ Hold Trend State para que la tendencia sobreviva a sus pausas, con el comportamiento histórico disponible en un clic
▸ Toda vuelta de tendencia pasa por neutro, así que siempre hay una salida entre dos entradas opuestas
▸ Marcas de Long, Short y salida impresas en la vela donde el estado realmente cambia
▸ Velas pintadas con el color del estado, con opacidad regulable para las velas alcistas
▸ Interruptores independientes para pintar la línea y para pintar las velas
▸ Input libre, para construir la media sobre cualquier otra serie del gráfico
▸ Estado expuesto como una única serie, legible desde Strategy Builder y desde otros indicadores
Parámetros
| Parámetro | Descripción |
|---|---|
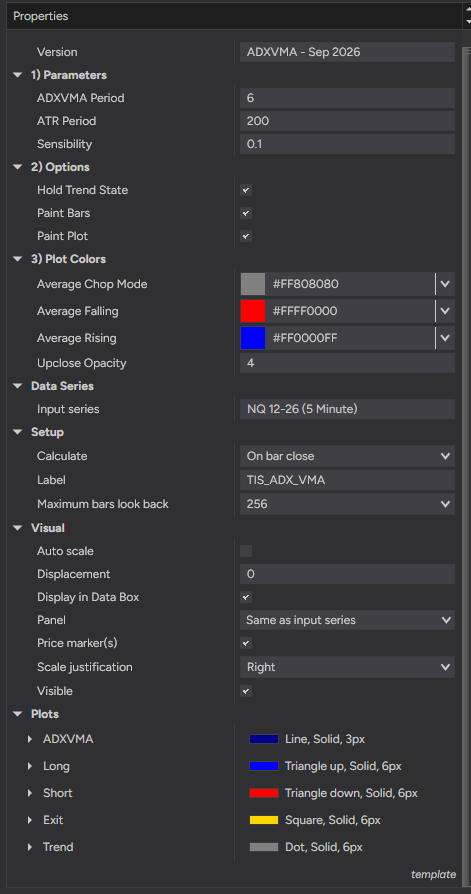
| ADXVMA Period | Período de suavizado de la media y del índice direccional interno. Valores bajos reaccionan antes y cambian de estado más seguido. |
| ATR Period | Período del ATR que dimensiona el umbral de cambio de estado. |
| Sensibility | Fracción de ese ATR que la media tiene que moverse de una vela a la otra para que el estado cambie. Valores altos exigen un movimiento mayor y producen menos cambios y más tardíos. Con Hold Trend State desactivado, el umbral también tiene que superarse en cada vela para que el estado sobreviva, así que valores altos hacen además más difícil sostener la tendencia. |
| Hold Trend State | Activado por defecto. El estado se mantiene a través de las velas que no superan el umbral y solo cambia ante un movimiento mayor en la dirección contraria. Desactivado, el estado se recalcula con el movimiento de cada vela, que es el comportamiento histórico del indicador. |
| Paint Bars | Pinta las velas con el color del estado actual. |
| Paint Plot | Colorea la media según el estado. Al desactivarlo, la línea queda de un color fijo. |
| Average Chop Mode / Falling / Rising | Colores de los estados neutro, bajista y alcista, aplicados tanto a la línea como a las velas. |
| Upclose Opacity | Intensidad del relleno de las velas alcistas, en una escala de 0 a 9. Las velas bajistas van siempre sólidas, así que las dos se distinguen dentro del mismo estado. |
Plots Y Series
▸ ADXVMA: la media, coloreada según el estado
▸ Long, Short y Exit: una serie por evento, con valor solo en la vela del cambio de estado
▸ Trend: el estado como un único número, +1, 0 o -1
▸ Todas disponibles desde Strategy Builder y desde NinjaScript, y legibles por otros indicadores a través del Input
¿Para Quién Es?
Para quien sigue tendencias y termina picado por medias de período fijo, y quiere una línea que admita cuando no hay tendencia en lugar de producir un cruce cada pocas velas. Funciona como disparador completo, con los triángulos y el cuadrado marcando entradas y salidas, y también como filtro de régimen debajo de un setup más rápido, donde lo único que se toma es si el estado es alcista, bajista o neutro.
Listo para automatizar. Las series de entrada, salida y estado están expuestas para Strategy Builder, así que la lógica de tres estados puede manejar una estrategia automática sin escribir código: un estado positivo abre largos, uno negativo abre cortos, y la serie Exit cierra la posición cuando la tendencia vuelve a neutro. El mismo indicador está disponible también para TradingView y funciona con nuestro sistema TIS_Automator.
TIS_ADX_VMA for NinjaTrader 8 is a moving average that changes its own speed depending on how one sided the market is. It tracks price closely while a move is clean and directional, and flattens out almost completely once the market turns choppy, so the line itself tells you which of the two you are in.
How It Works
Behind the line there is a directional index that measures how much of the recent movement went in a single direction. That index is compared against its own recent range. When it sits near the top of that range, the market is moving with conviction and the average is allowed to track price closely. When it collapses toward the bottom, the average slows down until it is almost frozen. That is why the line stops wandering during consolidations instead of cutting back and forth through price the way a fixed length average does.
On top of the average there are three states: rising, falling and neutral. A state change is not triggered by any movement at all, only by one larger than a fraction of the current ATR. That fraction is the Sensibility setting, and because the threshold is measured in ATR rather than in points, the same value behaves consistently across instruments and timeframes.
The neutral state is the part most averages do not give you. Instead of being forced to read every crossing as either long or short, you get an explicit third reading for when there is nothing there, which is also the natural exit.
Hold Trend State decides how firm that state is. On, which is the default, a trend survives its own pauses: it is kept even when the average does not advance enough on a given bar, and it only changes when the average moves more than the threshold in the opposite direction. Off restores the historical behaviour of the indicator, where the state is rebuilt from scratch on every bar and drops to neutral as soon as one bar fails to clear the threshold. In both modes the trend never jumps from rising to falling in a single bar: it passes through neutral, so there is always an exit between two opposite entries.
Everything is evaluated on the bar close. Once a bar has closed, its state and its markers are final and never change.
Key Features
▸ Self adjusting average: fast while the move is directional, nearly flat while the market chops
▸ Three explicit states, rising, falling and neutral, instead of a binary above or below reading
▸ State changes gated by an ATR based threshold, so one setting travels across instruments and timeframes
▸ Hold Trend State keeps a trend through its pauses, with the historical behaviour one click away
▸ Every trend change passes through neutral, so there is always an exit between two opposite entries
▸ Long, short and exit markers printed on the bar where the state actually changes
▸ Candle painting in the state color, with adjustable fill strength for up close bars
▸ Independent switches for coloring the line and coloring the candles
▸ Free Input series, so the average can be built on any other series on the chart
▸ Trend state exposed as a single series, readable from Strategy Builder and from other indicators
Parameters
| Parameter | Description |
|---|---|
| ADXVMA Period | Smoothing period of the average and of the internal directional index. Lower values react sooner and change state more often. |
| ATR Period | Period of the ATR that sizes the state change threshold. |
| Sensibility | Fraction of that ATR the average has to move, from one bar to the next, before the state changes. Higher values demand a bigger move and produce fewer and later changes. With Hold Trend State off, the threshold also has to be cleared on every bar for the state to survive, so higher values make the trend harder to hold as well. |
| Hold Trend State | On by default. The state persists through bars that do not clear the threshold and only changes on a larger move in the opposite direction. Off, the state is recomputed from each bar’s movement, which is the historical behaviour of the indicator. |
| Paint Bars | Paints the candles in the color of the current state. |
| Paint Plot | Colors the average according to the state. Turn it off to keep the line in one fixed color. |
| Average Chop Mode / Falling / Rising | Colors used for the neutral, falling and rising states, on both the line and the candles. |
| Upclose Opacity | Fill strength of the up close candles, on a 0 to 9 scale. Down close candles are always solid, so the two are easy to tell apart inside the same state. |
Plots And Series
▸ ADXVMA: the average itself, colored by state
▸ Long, Short and Exit: one series per event, carrying a value only on the bar where the state changes
▸ Trend: the state as a single number, +1, 0 or -1
▸ All of them are available from Strategy Builder and NinjaScript, and can be read by other indicators through the Input series
Who Is It For?
Trend followers who keep getting chopped up by fixed length averages and want a line that admits when there is no trend rather than producing a crossing every few bars. It works as a standalone trigger, with the triangles and the square marking entries and exits, and equally well as a regime filter sitting under a faster setup, where the only thing you take from it is whether the state is rising, falling or neutral.
Automation ready. The entry, exit and state series are exposed for Strategy Builder, so the three state logic can drive an automated strategy without writing code: a positive state opens longs, a negative one opens shorts, and the Exit series closes the position when the trend returns to neutral. The same indicator is also available for TradingView and works with our TIS_Automator system.
Solo los clientes que hayan comprado este producto pueden dejar una opinión.
Productos relacionados
-


-
Oferta
¡Oferta!
TIS_EMA_Trader
El precio original era: $210.00.$168.00El precio actual es: $168.00. -
-
Opiniones
Aún no hay opiniones.