TIS_Awesome_Oscillator for TradingView
This indicator is available by subscription only. Subscribe on our TradingView page →Este indicador está disponible solo por suscripción. Suscribite desde nuestra página de TradingView →
Histograma de momentum en Pine Script que detecta automáticamente el platillo: la pausa corta dentro de un movimiento en la que el momentum cede sin cambiar de lado y después retoma. Señales de continuación en los dos sentidos, con alertas y compatible con TIS_Automator.
Pine Script momentum histogram that automatically detects the saucer: the short pause inside a move where momentum dips without changing sides and then resumes. Continuation signals on both sides, alert-ready and compatible with TIS_Automator.
Descripción
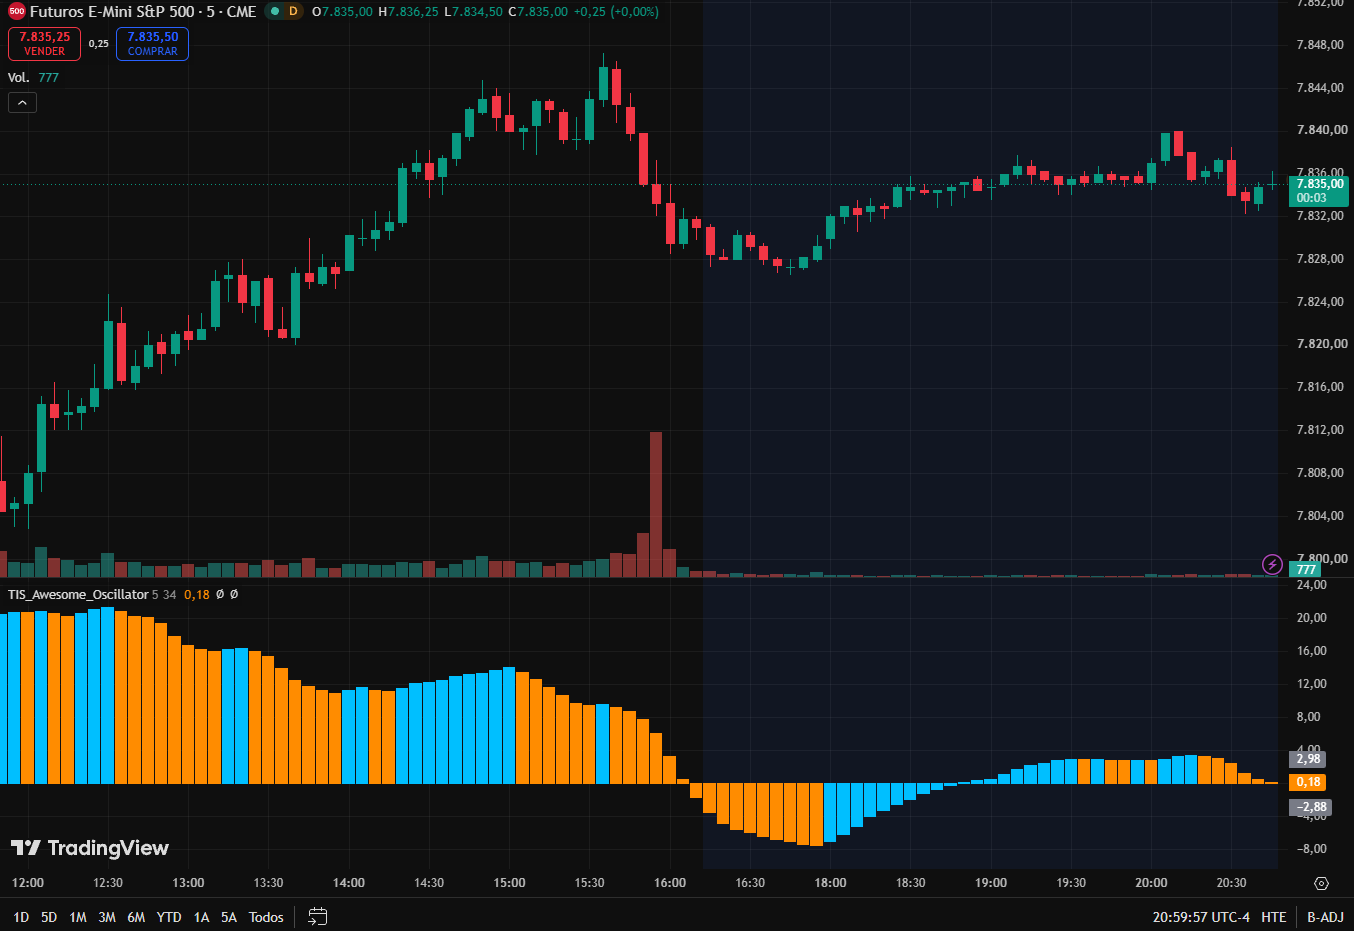
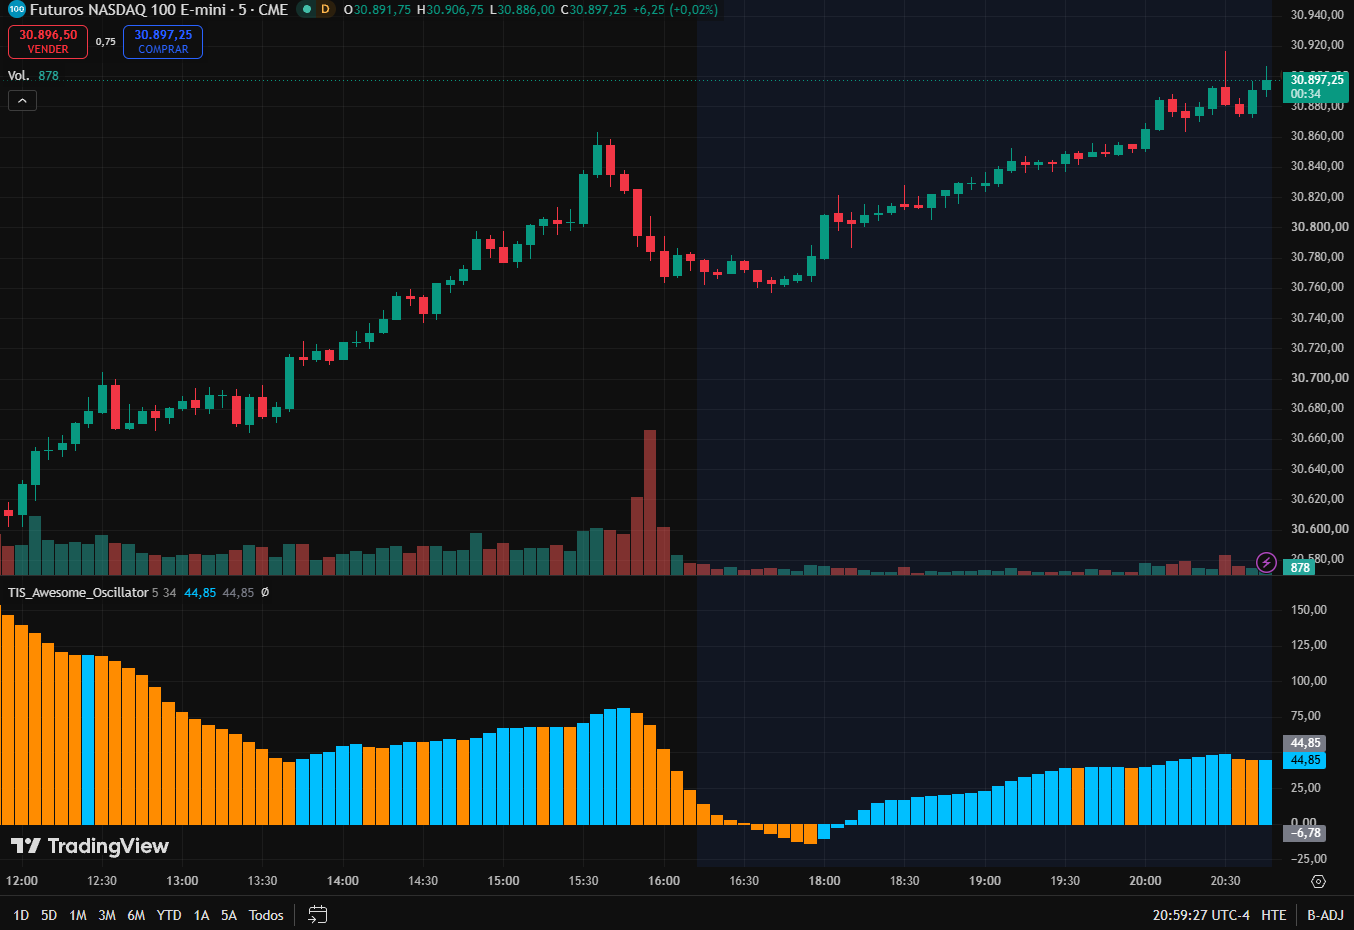
TIS_Awesome_Oscillator para TradingView dibuja el histograma de momentum que ya conocés, y agrega la parte que la mayoría de las versiones deja librada al ojo: detecta el platillo, esa pausa corta dentro de un movimiento, y marca la barra donde el momentum vuelve a arrancar.
Cómo funciona
El histograma es la distancia entre una media rápida y una lenta del precio medio de cada barra. Por encima de cero la media rápida va adelante y el momentum es alcista, por debajo es al revés. Cada columna se colorea según su propia dirección y no según su signo, así que un histograma que todavía es positivo pero se está achicando ya se lee como momentum que se apaga, antes de cruzar nada.
El platillo es el patrón que vive dentro de ese coloreo. Un platillo alcista necesita que el histograma se mantenga por encima de cero mientras cede durante una barra y después vuelve a subir: el momentum hizo una pausa pero nunca cambió de lado, y acaba de retomar. El platillo bajista es la imagen espejo por debajo de cero. Es una lectura de continuación, no de reversión, y eso es lo que lo separa de esperar un cruce de cero que llega mucho más tarde.
Los dos platillos se publican como salidas propias, así que otros scripts pueden tomarlos como fuente o se pueden mandar a alertas en lugar de buscarlos barra por barra. Vienen como series de datos, igual que en la versión de escritorio: subiles la opacidad en la pestaña Style si además querés verlos marcados sobre el histograma.
Todo se evalúa al cierre de la barra. Una vez que la barra cerró, su señal es definitiva y no cambia.
Características principales
▸ Histograma de momentum construido sobre el precio medio de cada barra, no sobre el cierre
▸ Columnas coloreadas por dirección y no por signo, así el momentum que se apaga se ve antes de cualquier cruce
▸ Detección automática del platillo: la pausa y el reinicio dentro del movimiento, sin esperar el cruce de cero
▸ Platillos alcistas restringidos al lado positivo y bajistas al lado negativo
▸ Los dos períodos son configurables, así el oscilador se puede reajustar para instrumentos más rápidos o más lentos
▸ Platillos largos y cortos expuestos como salidas separadas, seleccionables como fuente por otros scripts
▸ Alertas para los dos lados
▸ Valores disponibles desde la tercera barra del gráfico, sin un calentamiento largo antes de que aparezca el histograma
Parámetros
| Parámetro | Descripción |
|---|---|
| Period Fast | Período de la media rápida del precio medio. Valores más bajos hacen que el histograma reaccione antes y produzca más platillos. |
| Period Slow | Período de la media lenta. La distancia entre los dos períodos es lo que define la escala del histograma. |
¿Para quién es?
Para el trader que ya trabaja con histogramas de momentum y quiere la entrada de continuación marcada en vez de buscada a ojo, sobre todo en temporalidades bajas donde la pausa son dos o tres columnas y se pasa fácil. También funciona bien como segunda opinión debajo de una herramienta de tendencia: la tendencia decide el lado y el platillo decide la barra.
Listo para automatizar. TIS_Awesome_Oscillator es totalmente compatible con nuestro sistema TIS_Automator: seleccionás las salidas de platillo largo y corto como fuentes de señal, definís target y stop, y las entradas de continuación se operan de punta a punta sin intervención manual.
TIS_Awesome_Oscillator for TradingView plots the momentum histogram you already know, and adds the part most versions leave to the eye: it detects the saucer, the short pause inside a move, and marks the bar where momentum picks back up.
How It Works
The histogram is the distance between a fast and a slow average of the median price of each bar. Above zero the faster average is leading and momentum is bullish, below zero the opposite. Each column is colored by its own direction rather than by its sign, so a histogram that is still positive but shrinking already reads as fading before it crosses anything.
The saucer is the pattern that lives inside that coloring. A bullish saucer needs the histogram to stay above zero while it dips for a bar and then turns back up: momentum paused but never changed sides, and it has just resumed. The bearish saucer is the mirror image below zero. That is a continuation read, not a reversal one, which is what separates it from waiting for a zero cross that arrives much later.
Both saucers are published as their own outputs, so they can be picked up as sources by other scripts or routed into alerts instead of being spotted bar by bar. They ship as data series, the same way they do in the desktop version: raise their opacity in the Style tab if you also want to see them marked on the histogram.
Everything is evaluated on the bar close. Once a bar has closed, its signal is final and never changes.
Key Features
▸ Momentum histogram built on the median price of each bar, not on the close
▸ Columns colored by direction rather than by sign, so fading momentum shows up before any cross
▸ Automatic saucer detection: the pause and resumption inside a move, without waiting for a zero cross
▸ Bullish saucers restricted to the positive side and bearish saucers to the negative side
▸ Both averaging periods configurable, so the oscillator can be retuned for faster or slower instruments
▸ Long and short saucers exposed as separate outputs, selectable as sources by other scripts
▸ Alert conditions for both sides
▸ Values available from the third bar of the chart, with no long warm up before the histogram appears
Parameters
| Parameter | Description |
|---|---|
| Period Fast | Period of the fast average of the median price. Lower values make the histogram react sooner and produce more saucers. |
| Period Slow | Period of the slow average. The gap between the two periods is what sets the scale of the histogram. |
Who Is It For?
Traders who already work with momentum histograms and want the continuation entry marked instead of eyeballed, especially on lower timeframes where the pause is two or three columns and easy to miss. It also works well as a second opinion under a trend tool: the trend decides the side, and the saucer decides the bar.
Automation ready. TIS_Awesome_Oscillator is fully compatible with our TIS_Automator system: select the long and short saucer outputs as signal sources, set your target and stop, and the continuation entries can be traded end to end without manual intervention.
Solo los clientes que hayan comprado este producto pueden dejar una opinión.
Productos relacionados
-
-
-
Popular
-
Opiniones
Aún no hay opiniones.