TIS_Divergence for TradingView
Detectá divergencias regulares entre el precio y cualquier indicador que elijas —RSI, MACD, CCI, Estocástico o una media móvil— con señales Entry Long/Short claras y confirmadas, listas para alertas de TradingView y TIS_Automator.
Descripción
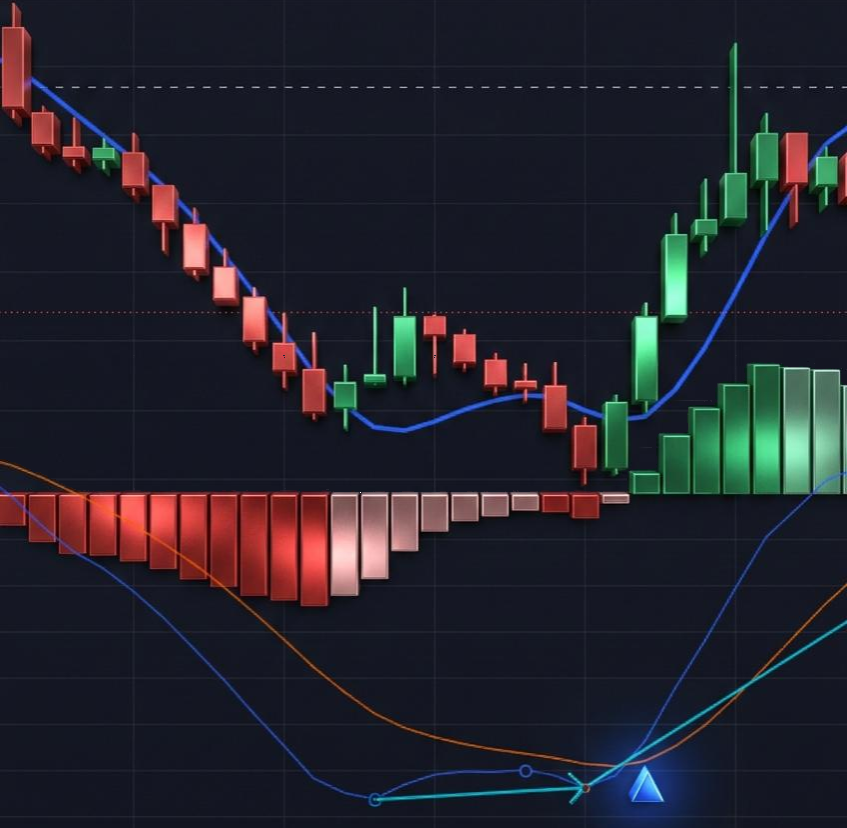
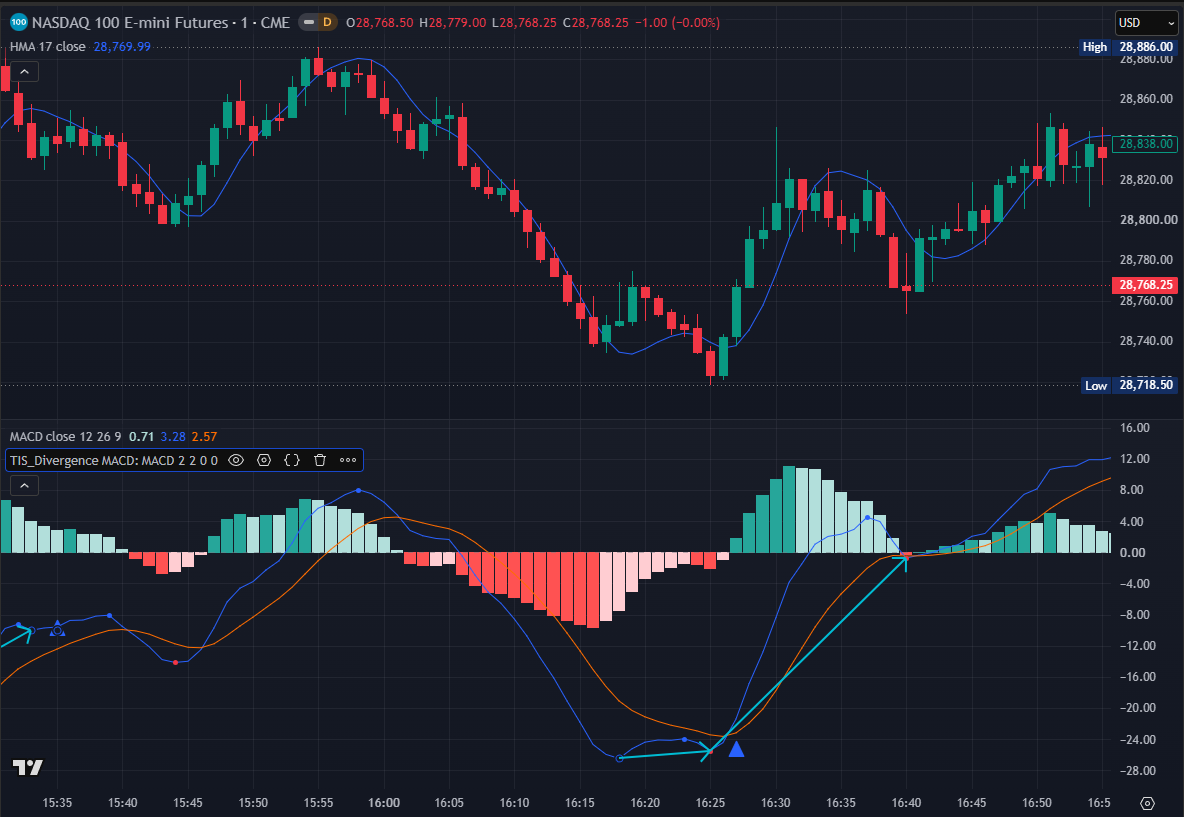
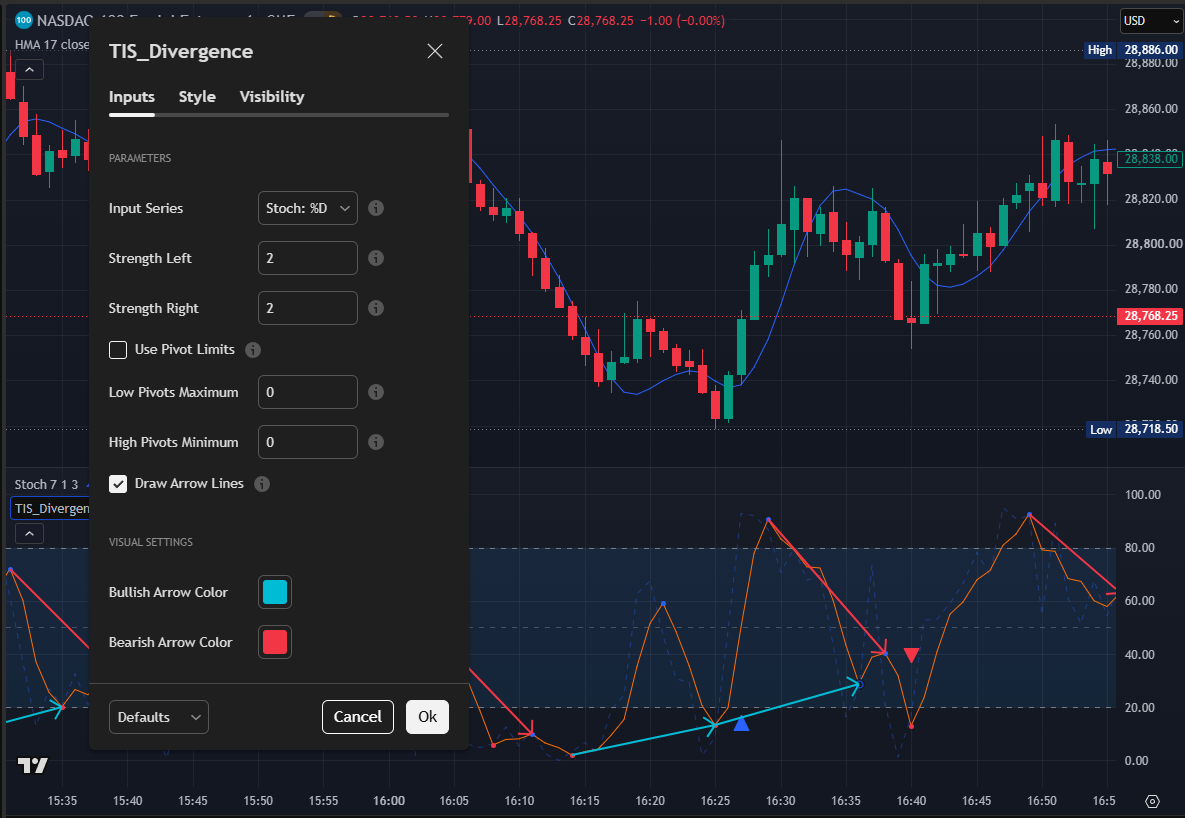
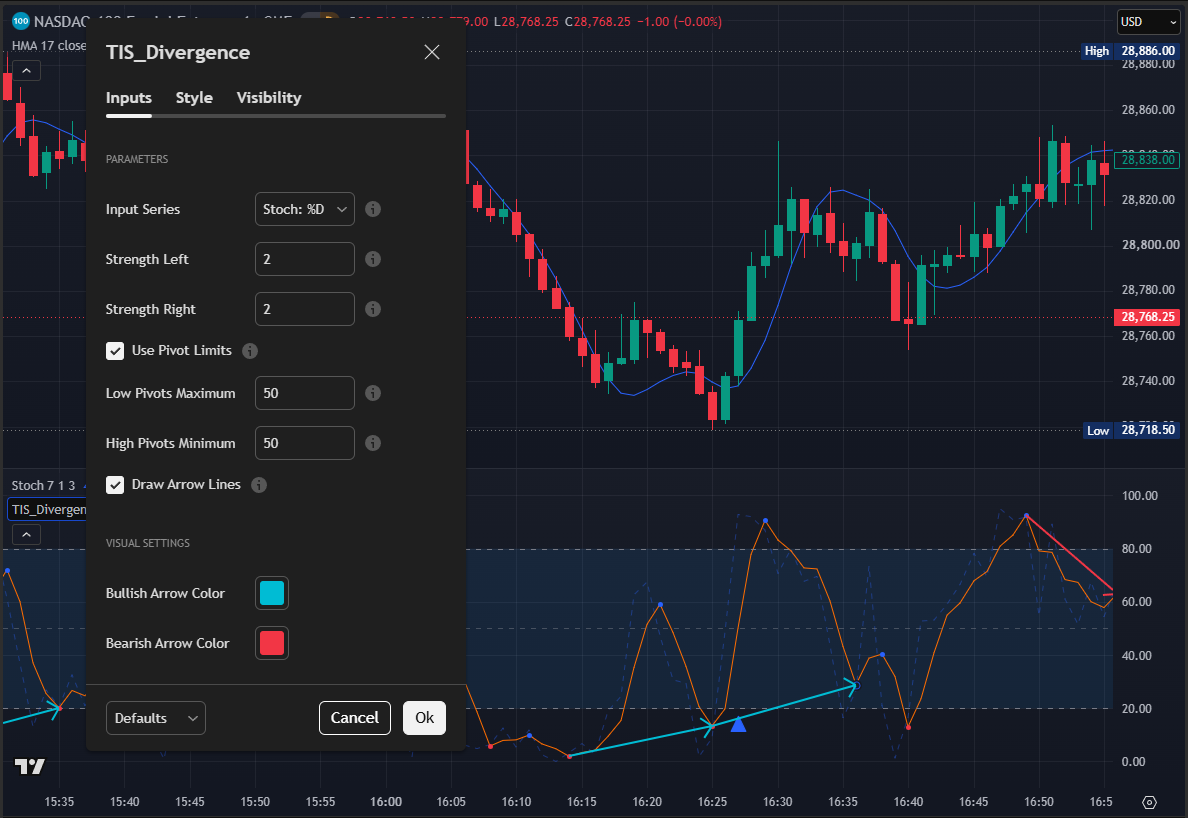
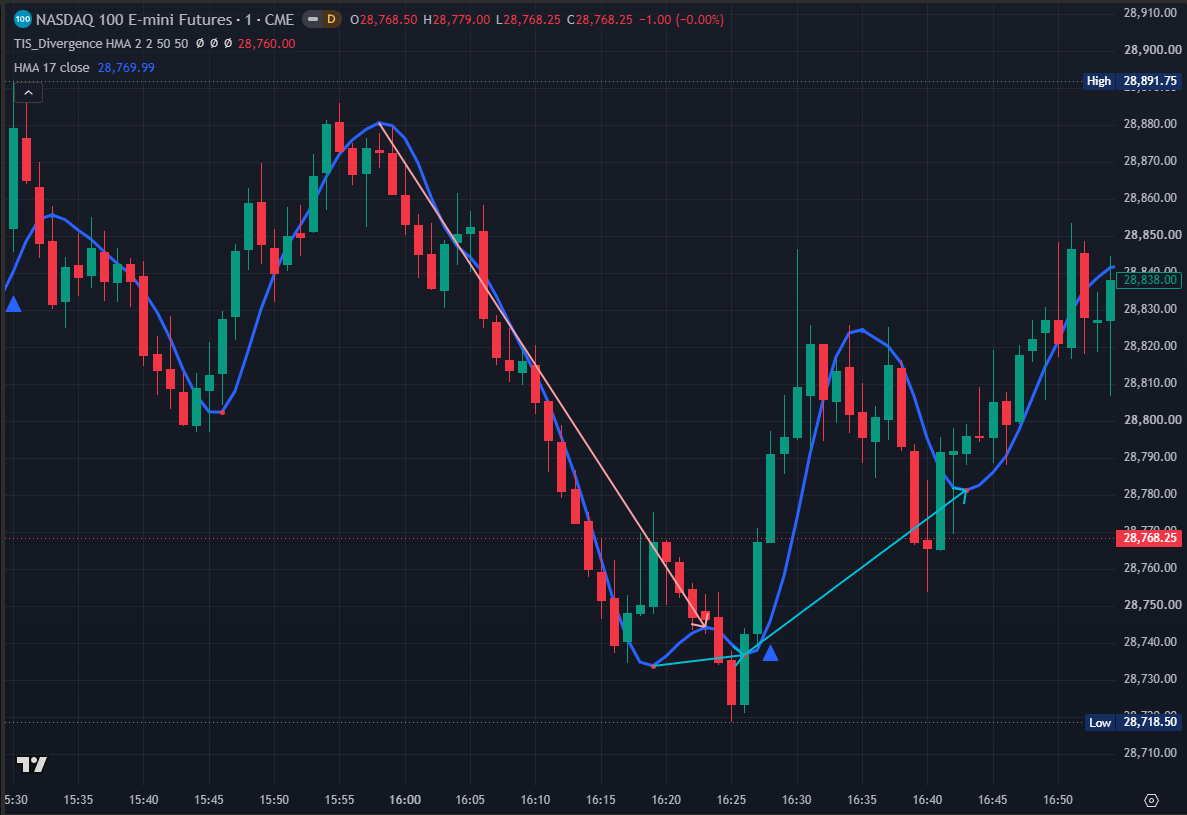
TIS_Divergence para TradingView detecta divergencias regulares entre el precio y cualquier indicador que elijas como Serie de Entrada. Apuntalo a un RSI, MACD, CCI, Estocástico, o a cualquier oscilador de momentum o de volumen en un panel inferior, o a una media móvil sobre el panel de precio (HMA, EMA, SMA): el script encuentra los pivots de la serie seleccionada, une con una flecha los dos pivots que forman una divergencia e imprime un triángulo Entry Long o Entry Short cuando el indicador y el precio no coinciden en sus pivots.
Cómo funciona
El script identifica los pivots de la Serie de Entrada con dos ajustes. Strength Left es cuántas barras a la izquierda de un pivot candidato deben ser más altas (para un mínimo) o más bajas (para un máximo); Strength Right es cuántas barras a la derecha se necesitan para confirmarlo. Como un pivot recién es válido cuando esas barras de la derecha cerraron, cada pivot — y cualquier señal que se apoye en él — se confirma con un retraso de Strength Right barras. Ese es el compromiso a cambio de pivots estables: una vez que la señal se imprime no se mueve ni desaparece, pero aparece algunas barras después del pivot, no en tiempo real sobre la barra del pivot.
Una señal alcista (Entry Long) aparece cuando el indicador hace un mínimo más alto mientras el precio hace un mínimo más bajo entre los mismos dos pivots — divergencia alcista regular. Una señal bajista (Entry Short) aparece cuando el indicador hace un máximo más bajo mientras el precio hace un máximo más alto — divergencia bajista regular. El filtro opcional Use Pivot Limits te permite exigir que el pivot esté de un lado dado de un nivel de referencia antes de aceptar la señal — por ejemplo, solo divergencias alcistas cuyo pivot bajo esté por debajo de 50 en un RSI, o solo divergencias del lado correcto de la línea cero en un MACD.
Características principales
- Funciona con prácticamente cualquier indicador con plot: elegí cualquier línea del chart — un oscilador de panel inferior o una media móvil del panel de precio — como Serie de Entrada
- Detecta divergencias alcistas y bajistas regulares (de tipo reversión) entre la serie seleccionada y el precio
- Sensibilidad de pivots ajustable, con Strength Left y Strength Right independientes
- Filtro opcional por nivel de pivot para aceptar divergencias solo de un lado elegido de un nivel de referencia (ej. 0 en MACD, 50 o 30/70 en RSI)
- Flecha que une los dos pivots que forman cada divergencia
- Puntos de pivot que marcan cada máximo y mínimo confirmado
- Triángulos Entry Long / Entry Short claros sobre la barra de la señal — confirmados, no se mueven ni repintan una vez impresos
- Totalmente compatible con las alertas de TradingView
Parámetros
| Parámetro | Descripción |
|---|---|
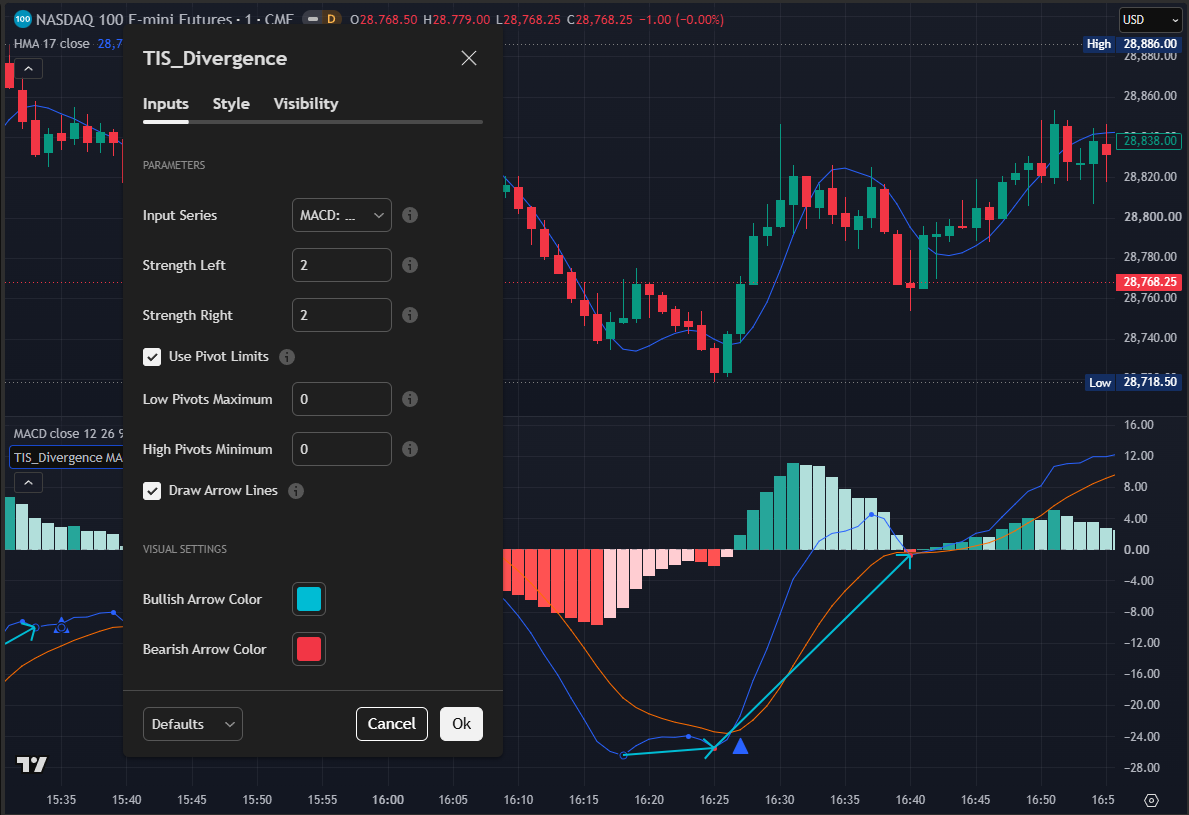
| Input Series | El plot del indicador usado para detectar pivots y divergencias contra el precio. |
| Strength Left / Strength Right | Sensibilidad del pivot: barras requeridas a la izquierda de un pivot y barras requeridas a la derecha para confirmarlo. Un Strength Right mayor da pivots más fiables pero un retraso de confirmación más largo. |
| Use Pivot Limits | Activa los dos filtros de nivel de abajo. Desactivado, cada divergencia genera señal sin importar el nivel del pivot. |
| Low Pivots Maximum | Solo los pivots bajos por debajo de este valor pueden generar señales alcistas (ej. 50 o 30 en un RSI, 0 en un MACD). |
| High Pivots Minimum | Solo los pivots altos por encima de este valor pueden generar señales bajistas (ej. 50 o 70 en un RSI, 0 en un MACD). |
| Draw Arrow Lines | Dibuja la línea que une los dos pivots de cada divergencia. |
| Bullish / Bearish Arrow Color | Colores de las líneas de divergencia. Los colores de los triángulos y de los puntos de pivot se editan en la pestaña Style. |
¿Para quién es?
TIS_Divergence está pensado para traders discrecionales que quieren una forma limpia y confirmada de detectar posibles zonas de agotamiento y reversión sobre su oscilador favorito, y para traders sistemáticos que quieren los eventos de divergencia como señales listas para alertas. Como la Serie de Entrada es totalmente seleccionable, un solo script cubre muchos flujos de divergencia — desde las clásicas de RSI y MACD hasta divergencias sobre indicadores propios o basados en volumen.
TIS_Divergence for TradingView detects regular divergences between price and any indicator you choose as its Input Series. Point it at an RSI, MACD, CCI, Stochastic, or any momentum or volume oscillator on a lower panel, or at a moving average on the price panel (HMA, EMA, SMA): the script finds the swing pivots of the selected series, connects the two pivots that form a divergence with an arrow line, and prints an Entry Long or Entry Short triangle when the indicator and price disagree at their pivots.
How It Works
The script identifies swing pivots on the selected Input Series using two settings. Strength Left is how many bars to the left of a candidate pivot must be higher (for a low) or lower (for a high); Strength Right is how many bars to the right are required to confirm it. Because a pivot is only valid once those right-hand bars have closed, each pivot — and any signal built on it — is confirmed with a delay of Strength Right bars. That is the trade-off for stable pivots: once a signal prints it does not move or disappear, but it appears a few bars after the pivot itself, not in real time on the pivot bar.
A bullish signal (Entry Long) appears when the indicator makes a higher low while price makes a lower low between the same two pivots — a regular bullish divergence. A bearish signal (Entry Short) appears when the indicator makes a lower high while price makes a higher high — a regular bearish divergence. The optional Use Pivot Limits filter lets you require the pivot to sit on a given side of a reference level before a signal is accepted — for example only bullish divergences whose low pivot is below 50 on an RSI, or only divergences on the correct side of the zero line on a MACD.
Key Features
- Works with virtually any plotted indicator: pick any line on your chart — a sub-panel oscillator or a price-panel moving average — as the Input Series
- Detects regular (reversal-type) bullish and bearish divergences between the selected series and price
- Adjustable pivot sensitivity with independent Strength Left and Strength Right
- Optional pivot-level filter to accept divergences only on a chosen side of a reference level (e.g. 0 on MACD, 50 or 30/70 on RSI)
- Arrow line connecting the two pivots that form each divergence
- Pivot dots marking every confirmed swing high and swing low
- Clear Entry Long / Entry Short triangles on the signal bar — confirmed, and they do not move or repaint once printed
- Fully compatible with TradingView alerts
Parameters
| Parameter | Description |
|---|---|
| Input Series | The indicator plot used to detect pivots and divergences against price. |
| Strength Left / Strength Right | Pivot sensitivity: bars required to the left of a pivot, and bars required to the right to confirm it. Higher Strength Right means more reliable pivots but a longer confirmation delay. |
| Use Pivot Limits | Enable the two level filters below. When disabled, every divergence generates a signal regardless of the pivot level. |
| Low Pivots Maximum | Only low pivots below this value can generate bullish signals (e.g. 50 or 30 on an RSI, 0 on a MACD). |
| High Pivots Minimum | Only high pivots above this value can generate bearish signals (e.g. 50 or 70 on an RSI, 0 on a MACD). |
| Draw Arrow Lines | Draw the line connecting the two pivots of each divergence. |
| Bullish / Bearish Arrow Color | Colors of the divergence lines. Triangle and pivot dot colors are editable in the Style tab. |
Who Is It For?
TIS_Divergence is built for discretionary traders who want a clean, confirmed way to spot potential exhaustion and reversal areas on their favorite oscillator, and for systematic traders who want divergence events as alert-ready signals. Because the Input Series is fully selectable, a single script covers many divergence workflows — from classic RSI and MACD divergences to divergences on custom or volume-based indicators.
Solo los clientes que hayan comprado este producto pueden dejar una opinión.
Productos relacionados
-
-
Nuevo
-
Popular
-
Popular
Opiniones
Aún no hay opiniones.