TIS_ADX_VMA for TradingView
This indicator is available by subscription only. Subscribe on our TradingView page →Este indicador está disponible solo por suscripción. Suscribite desde nuestra página de TradingView →
Histograma de momentum en Pine Script que detecta automáticamente el platillo: la pausa corta dentro de un movimiento en la que el momentum cede sin cambiar de lado y después retoma. Señales de continuación en los dos sentidos, con alertas y compatible con TIS_Automator.
Pine Script adaptive moving average that speeds up while the market is directional and flattens out when it turns choppy. Three explicit states (rising, falling and neutral) with ATR-based filtering, long, short and exit markers, alert-ready and compatible with TIS_Automator.
Description
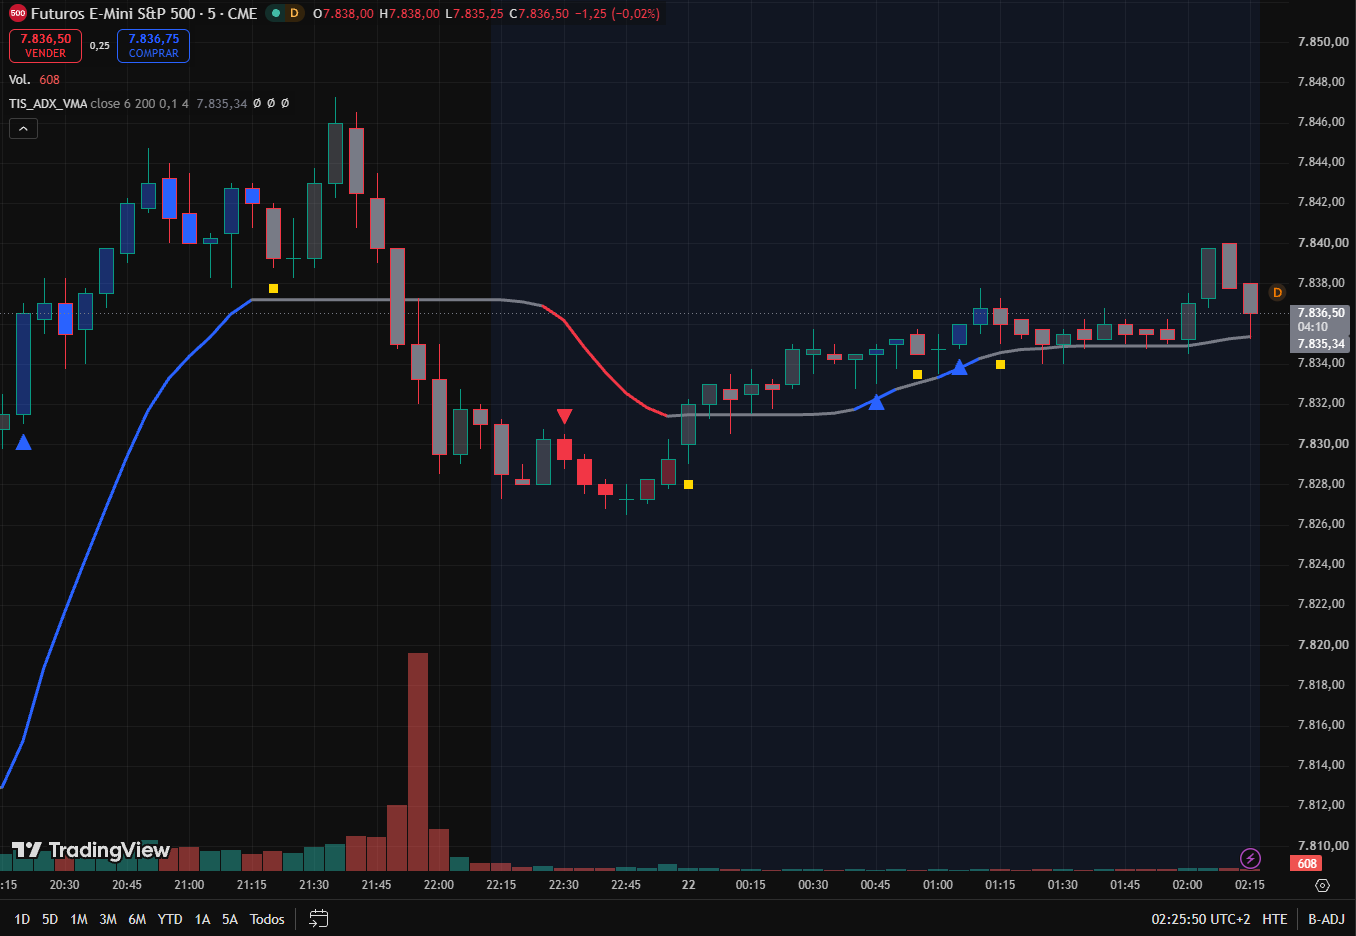
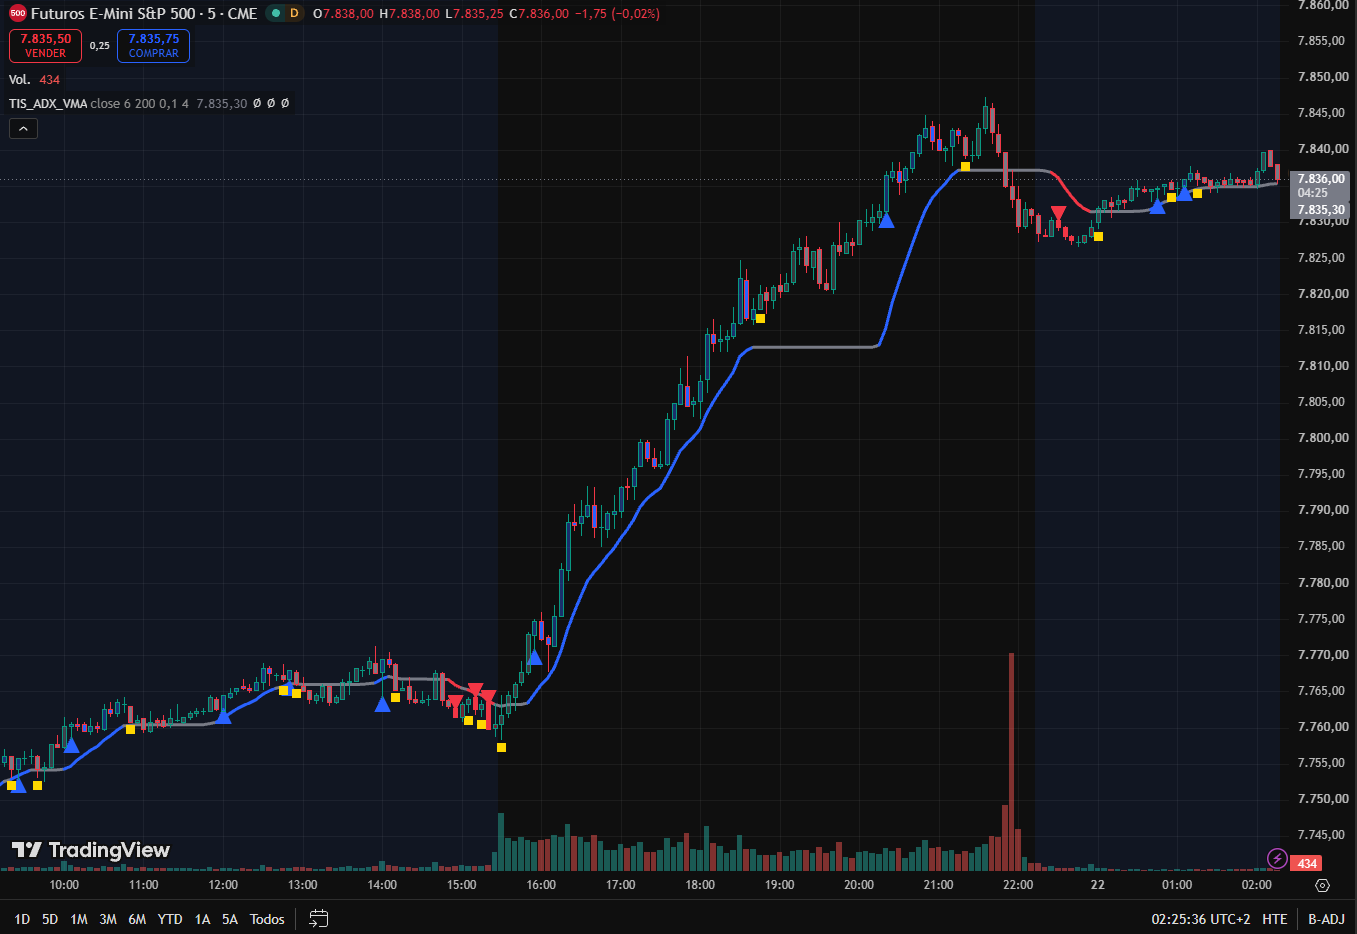
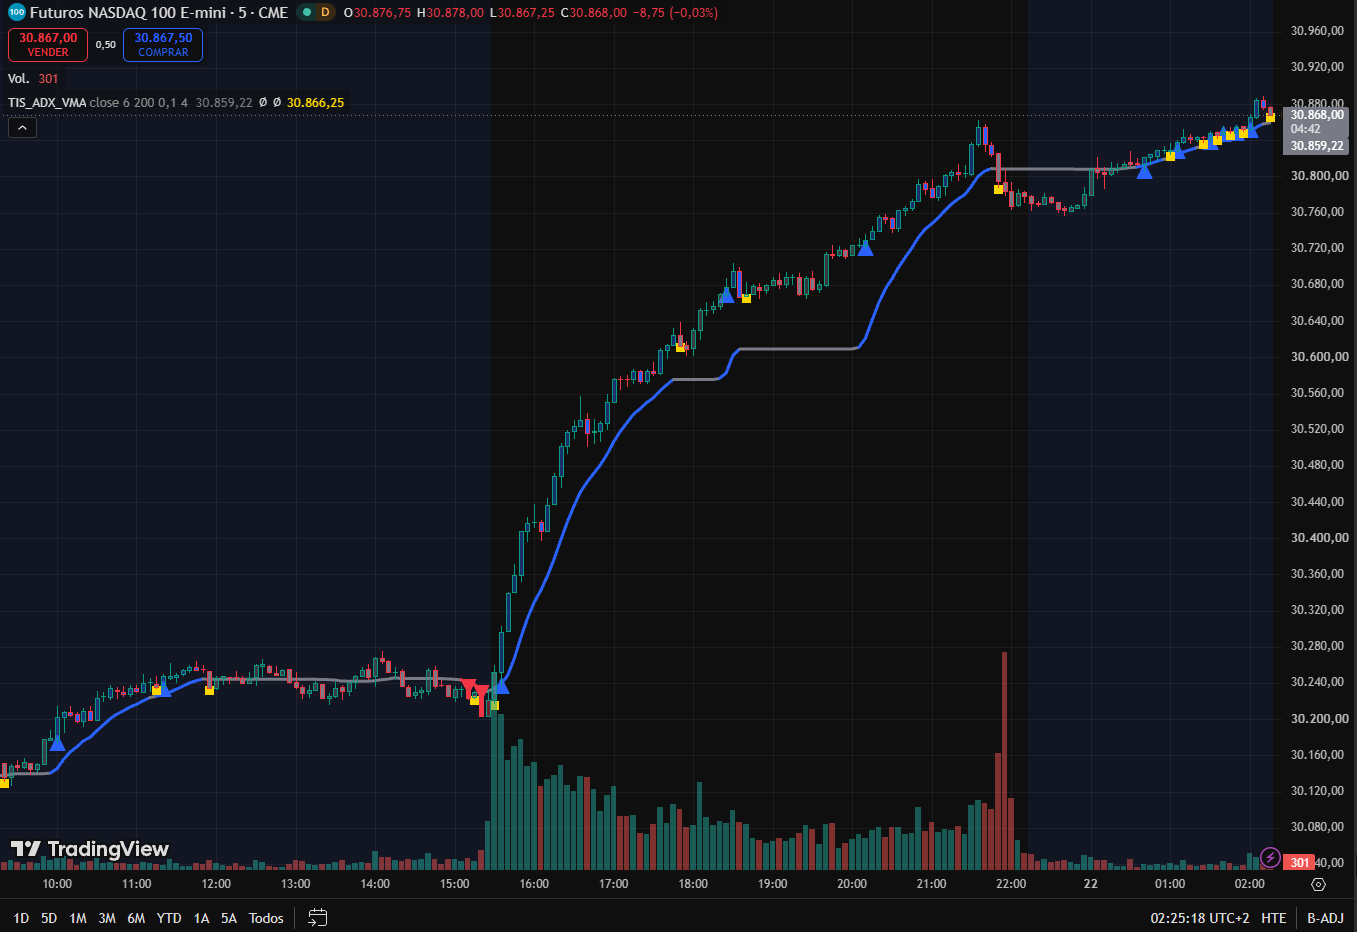
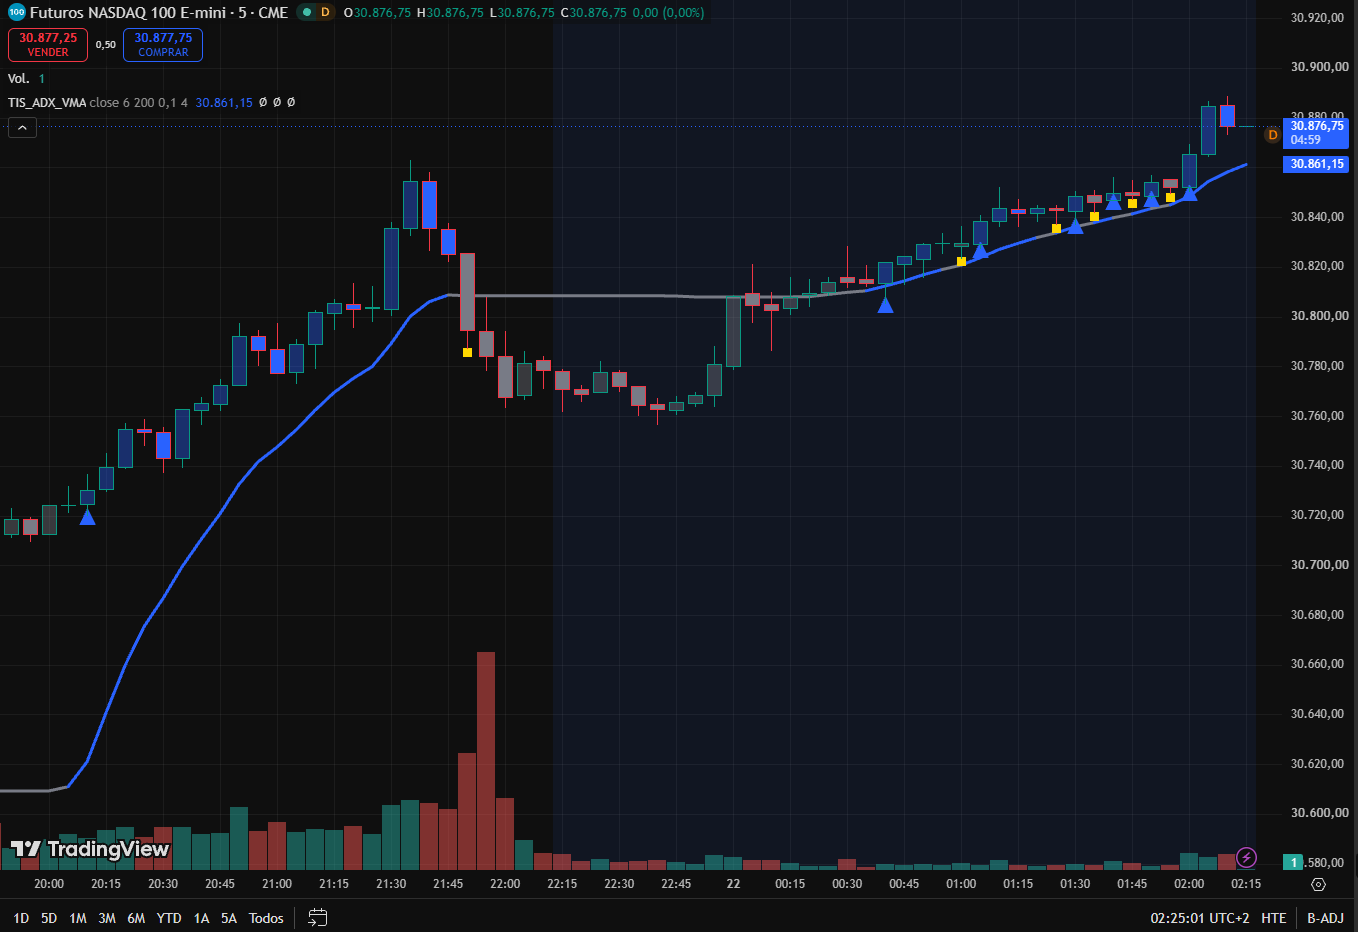
TIS_ADX_VMA para TradingView es una media móvil que cambia su propia velocidad según qué tan direccional esté el mercado. Sigue al precio de cerca mientras el movimiento es limpio, y se aplana apenas el mercado entra en rango, así la línea misma te dice en cuál de los dos estás.
Cómo funciona
Detrás de la línea hay un índice direccional que mide cuánto del movimiento reciente fue en una sola dirección. Ese índice se compara contra su propio rango reciente. Cuando está cerca del techo de ese rango, el mercado se mueve con convicción y la media puede seguir al precio de cerca. Cuando se desploma hacia el piso del rango, la media se frena hasta quedar casi congelada. Por eso la línea deja de zigzaguear durante las consolidaciones, en lugar de cruzar el precio de un lado al otro como hace una media de período fijo.
Sobre la media hay tres estados: subiendo, bajando y neutral. El cambio de estado no lo dispara cualquier movimiento, sino uno mayor a una fracción del ATR actual. Esa fracción es el parámetro Sensibility, y como el umbral se mide en ATR y no en puntos, el mismo valor se comporta de forma consistente entre instrumentos y temporalidades. El color de la línea y el de las velas siguen al estado, y se imprime un marcador cada vez que cambia: un triángulo cuando la tendencia gira al alza o a la baja, y un cuadrado cuando vuelve a neutral.
Ese estado neutral es justamente lo que la mayoría de las medias no te da. En lugar de tener que leer cada cruce como largo o corto, tenés una tercera lectura explícita para cuando no hay nada, que además es la salida natural.
Todo se evalúa al cierre de la barra. Una vez que la barra cerró, su estado y sus marcadores son definitivos y no cambian.
Características principales
▸ Media autoajustable: rápida mientras el movimiento es direccional, casi plana mientras el mercado lateraliza
▸ Tres estados explícitos, subiendo, bajando y neutral, en vez de una lectura binaria de arriba o abajo
▸ Cambios de estado filtrados por un umbral basado en ATR, así el mismo ajuste viaja entre instrumentos y temporalidades
▸ Marcadores de largo, corto y salida impresos en la barra donde el estado realmente cambia
▸ Pintado de velas con el color del estado, con intensidad ajustable para las velas de cierre alcista
▸ Interruptores independientes para colorear la línea y para colorear las velas
▸ Fuente configurable, la media se puede construir sobre cualquier serie del gráfico
▸ Estado de tendencia expuesto como salida única seleccionable, legible por otros scripts
▸ Alertas de largo, corto y salida
Parámetros
| Parámetro | Descripción |
|---|---|
| Source | Serie sobre la que se construye la media. Se puede seleccionar cualquier plot del gráfico. |
| ADXVMA Period | Período de suavizado de la media y del índice direccional interno. Valores más bajos reaccionan antes y cambian de estado más seguido. |
| ATR Period | Período del ATR que dimensiona el umbral de cambio de estado. |
| Sensibility | Fracción de ese ATR que la media debe recorrer para que el estado cambie. Valores más altos exigen un movimiento mayor y producen menos cambios, y más tardíos. |
| Paint Bars | Pinta las velas con el color del estado actual. |
| Paint Plot | Colorea la media según el estado. Desactivalo para dejar la línea en un color fijo. |
| Average Chop Mode / Falling / Rising | Colores de los estados neutral, bajista y alcista, tanto en la línea como en las velas. |
| Upclose Opacity | Intensidad de relleno de las velas de cierre alcista, en escala de 0 a 9. Las de cierre bajista van siempre sólidas, así se distinguen dentro del mismo estado. |
¿Para quién es?
Para el seguidor de tendencia al que las medias de período fijo le siguen dando cruces cada pocas barras y quiere una línea que admita cuándo no hay tendencia. Funciona como disparador autónomo, con los triángulos y el cuadrado marcando entradas y salidas, y también como filtro de régimen debajo de un setup más rápido, donde lo único que se toma de él es si el estado está subiendo, bajando o neutral.
Listo para automatizar. TIS_ADX_VMA es totalmente compatible con nuestro sistema TIS_Automator: seleccionás las salidas de largo y corto como fuentes de señal, o le pasás la salida única de tendencia y dejás que un valor positivo abra largos y uno negativo abra cortos, definís target y stop, y los cambios de estado se operan de punta a punta sin intervención manual.
TIS_ADX_VMA for TradingView is a moving average that changes its own speed depending on how one sided the market is. It runs close to price while a move is clean and directional, and flattens out the moment the market turns choppy, so the line itself tells you which of the two you are in.
How It Works
Behind the line there is a directional index that measures how much of the recent movement went in a single direction. That index is then compared against its own recent range. When it sits near the top of that range, the market is moving with conviction and the average is allowed to track price closely. When it collapses toward the bottom of the range, the average slows down until it is almost frozen. That is why the line stops wandering during consolidations instead of cutting back and forth through price the way a fixed length average does.
On top of the average there are three states: rising, falling and neutral. A state change is not triggered by any movement at all, only by a move larger than a fraction of the current ATR. That fraction is the Sensibility setting, and because the threshold is measured in ATR rather than in points, the same value behaves consistently across instruments and timeframes. The line color and the candles follow the state, and a marker is printed every time it changes: a triangle when the trend turns up or down, and a square when it drops back to neutral.
That neutral state is the part most averages do not give you. Instead of being forced to read every crossing as either long or short, you get an explicit third reading for when there is nothing there, which is also the natural exit.
Everything is evaluated on the bar close. Once a bar has closed, its state and its markers are final and never change.
Key Features
▸ Self adjusting average: fast while the move is directional, nearly flat while the market chops
▸ Three explicit states, rising, falling and neutral, instead of a binary above or below reading
▸ State changes gated by an ATR based threshold, so the same setting travels across instruments and timeframes
▸ Long, short and exit markers printed at the bar where the state actually changes
▸ Candle painting in the state color, with adjustable fill strength for up close bars
▸ Independent switches for coloring the line and coloring the candles
▸ Free choice of source, so the average can be built on any series on the chart
▸ Trend state exposed as a single selectable output, readable by other scripts
▸ Alert conditions for long, short and exit
Parameters
| Parameter | Description |
|---|---|
| Source | Series the average is built on. Any plot on the chart can be selected. |
| ADXVMA Period | Smoothing period of the average and of the internal directional index. Lower values react sooner and change state more often. |
| ATR Period | Period of the ATR that sizes the state change threshold. |
| Sensibility | Fraction of that ATR the average has to move before the state flips. Higher values demand a bigger move and produce fewer, later changes. |
| Paint Bars | Paints the candles in the color of the current state. |
| Paint Plot | Colors the average according to the state. Turn it off to keep the line in one fixed color. |
| Average Chop Mode / Falling / Rising | Colors used for the neutral, falling and rising states, on both the line and the candles. |
| Upclose Opacity | Fill strength of the up close candles, on a 0 to 9 scale. Down close candles are always solid, so the two are easy to tell apart inside the same state. |
Who Is It For?
Trend followers who keep getting chopped up by fixed length averages and want a line that admits when there is no trend rather than producing a crossing every few bars. It works as a standalone trigger, with the triangles and the square marking entries and exits, and equally well as a regime filter sitting under a faster setup, where the only thing you take from it is whether the state is rising, falling or neutral.
Automation ready. TIS_ADX_VMA is fully compatible with our TIS_Automator system: select the long and short outputs as signal sources, or feed it the single trend output and let a positive value open longs and a negative one open shorts, set your target and stop, and the state changes can be traded end to end without manual intervention.
Solo los clientes que hayan comprado este producto pueden dejar una opinión.
Related Products
-
New
-
-
Popular
-
Opiniones
Aún no hay opiniones.