TIS_PivotDensity
$250.00
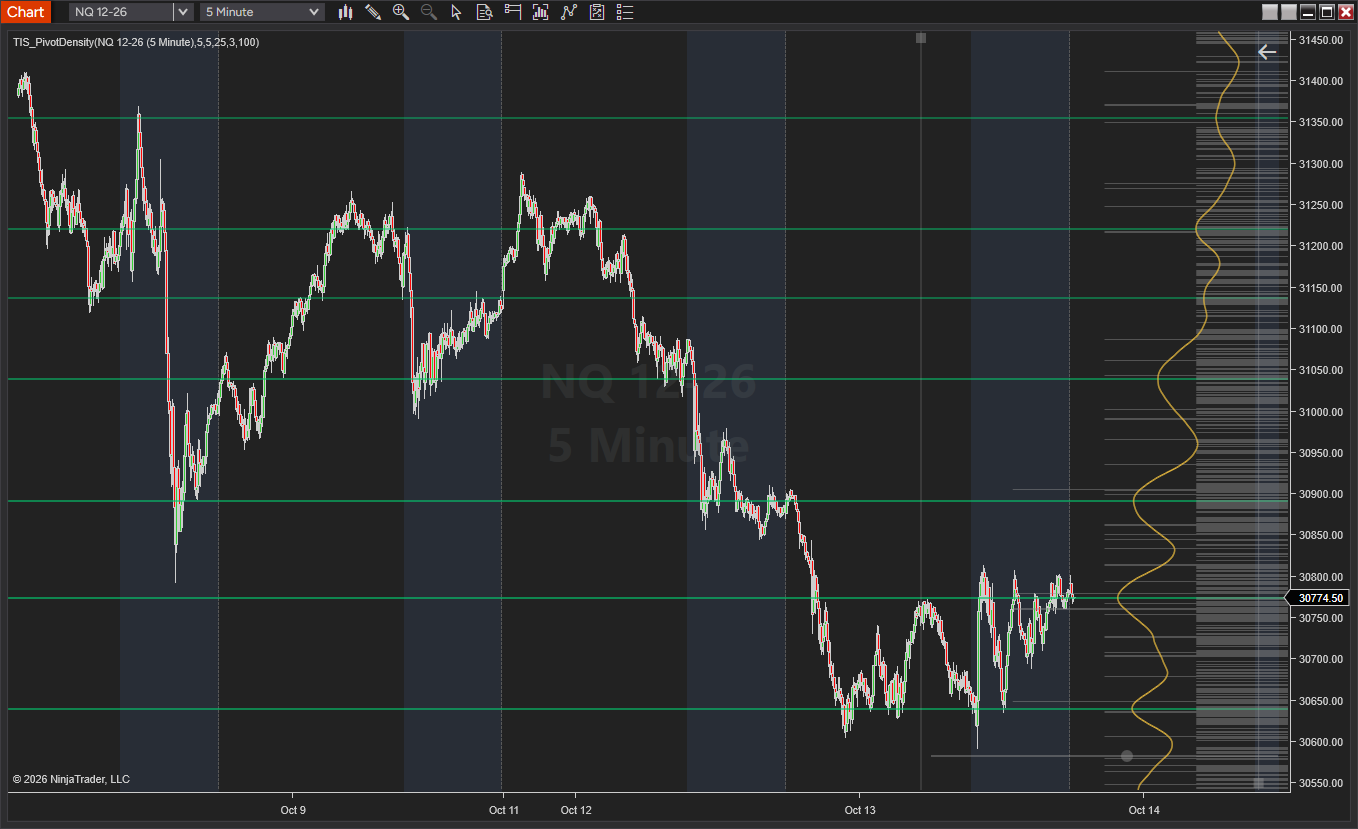
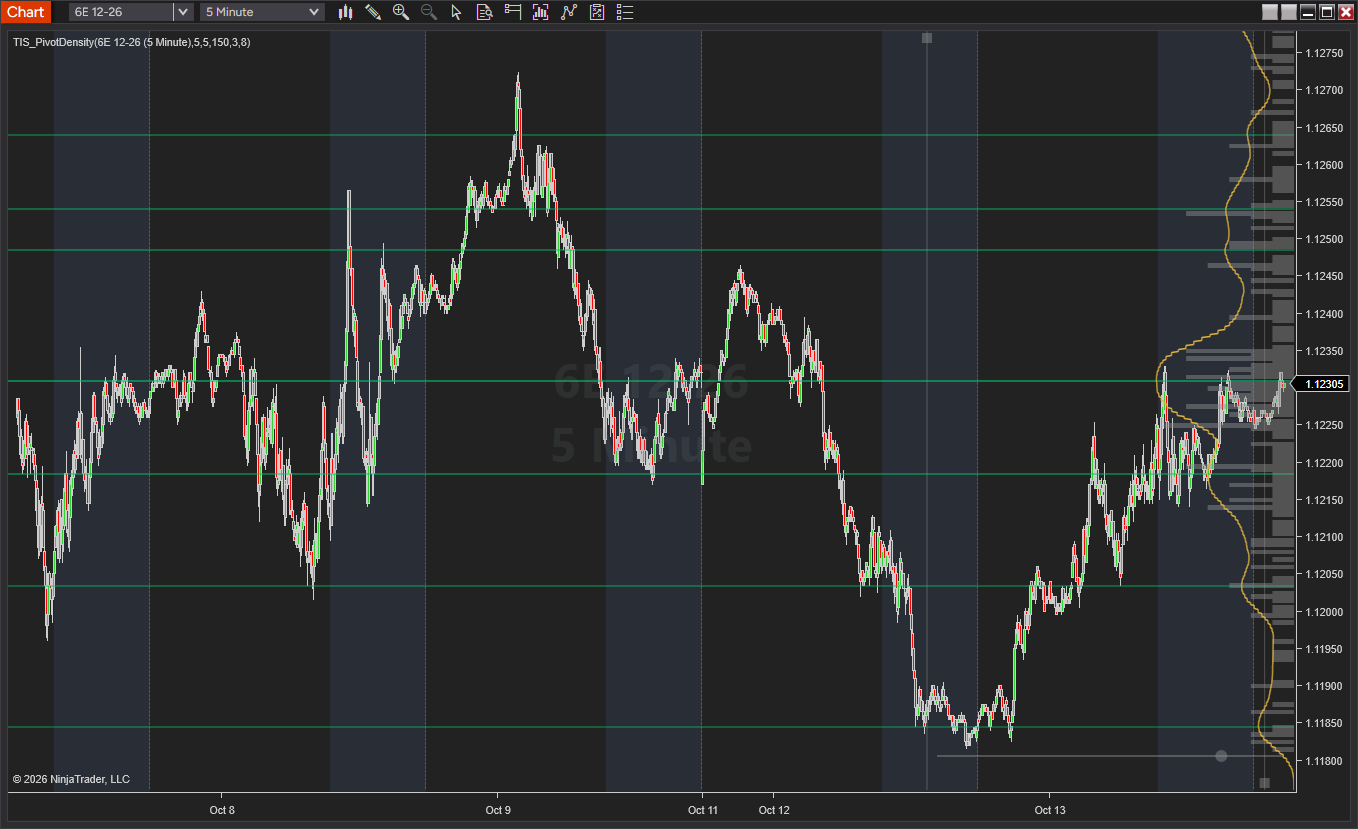
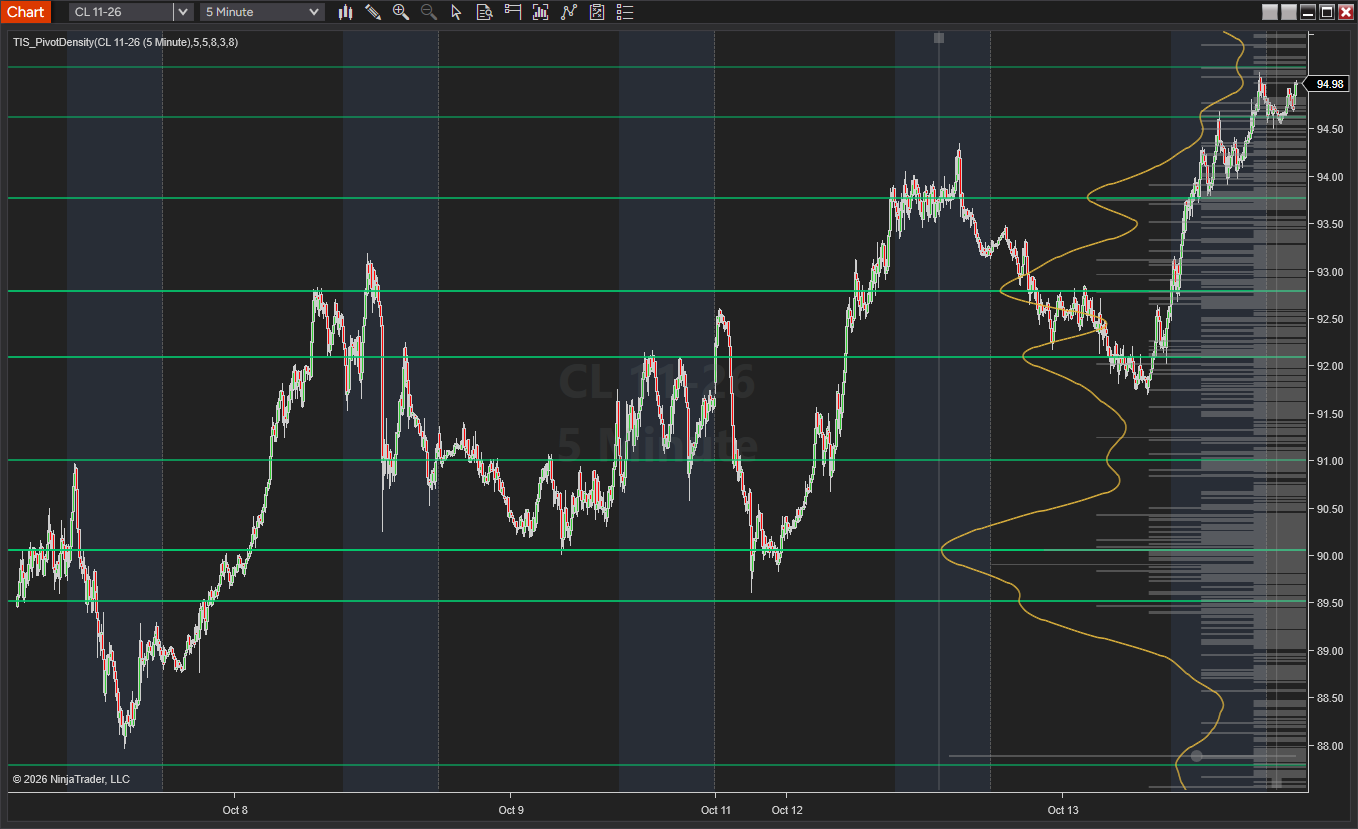
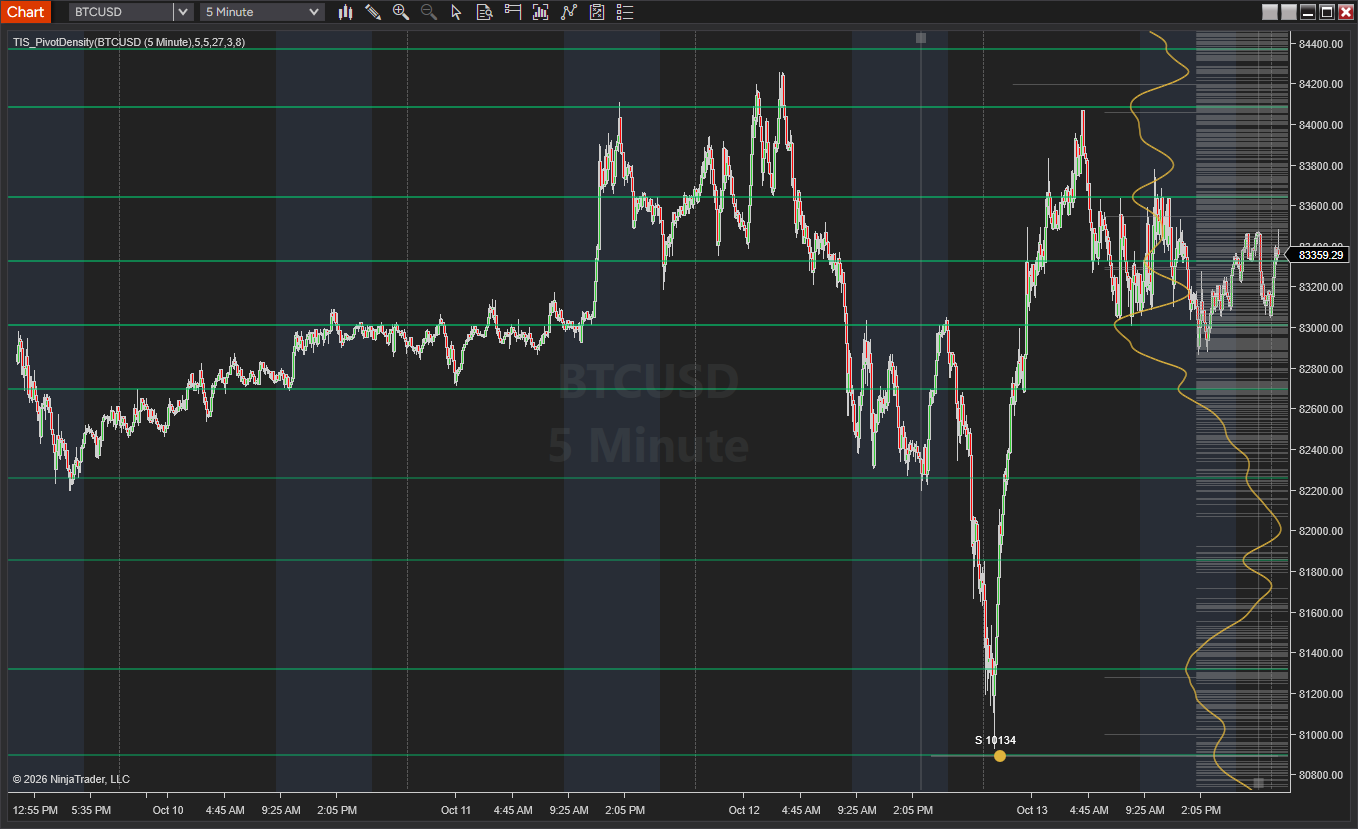
Encontrá los niveles de precio donde el mercado giró más veces. TIS_PivotDensity cuenta todos los pivots de swing del chart, convierte ese conteo en una curva de densidad suave y traza una línea solo en los niveles más fuertes. El ancho, el umbral y el suavizado se ajustan arrastrando directamente sobre el chart.
Find the price levels where the market has turned most often. TIS_PivotDensity counts every swing pivot on your chart, smooths that count into a density curve and draws a line only at the strongest levels. Width, threshold and smoothing are adjusted by dragging right on the chart.
Description
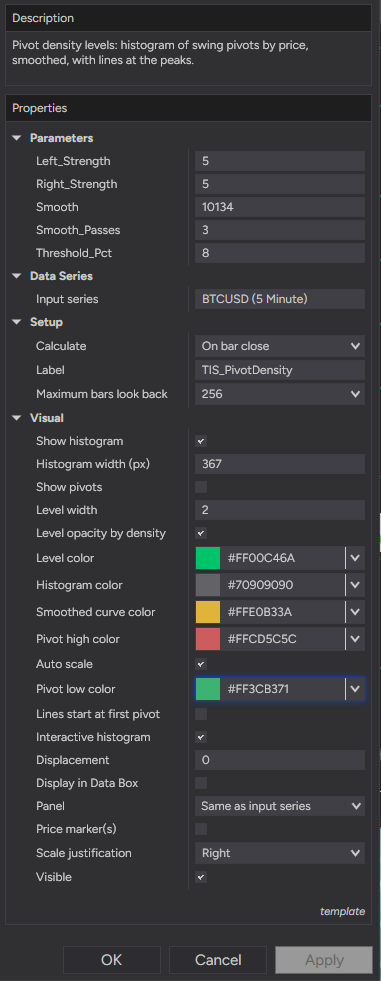
TIS_PivotDensity para NinjaTrader 8
Los niveles de precio donde el mercado giró más veces, detectados y dibujados automáticamente.
Qué hace
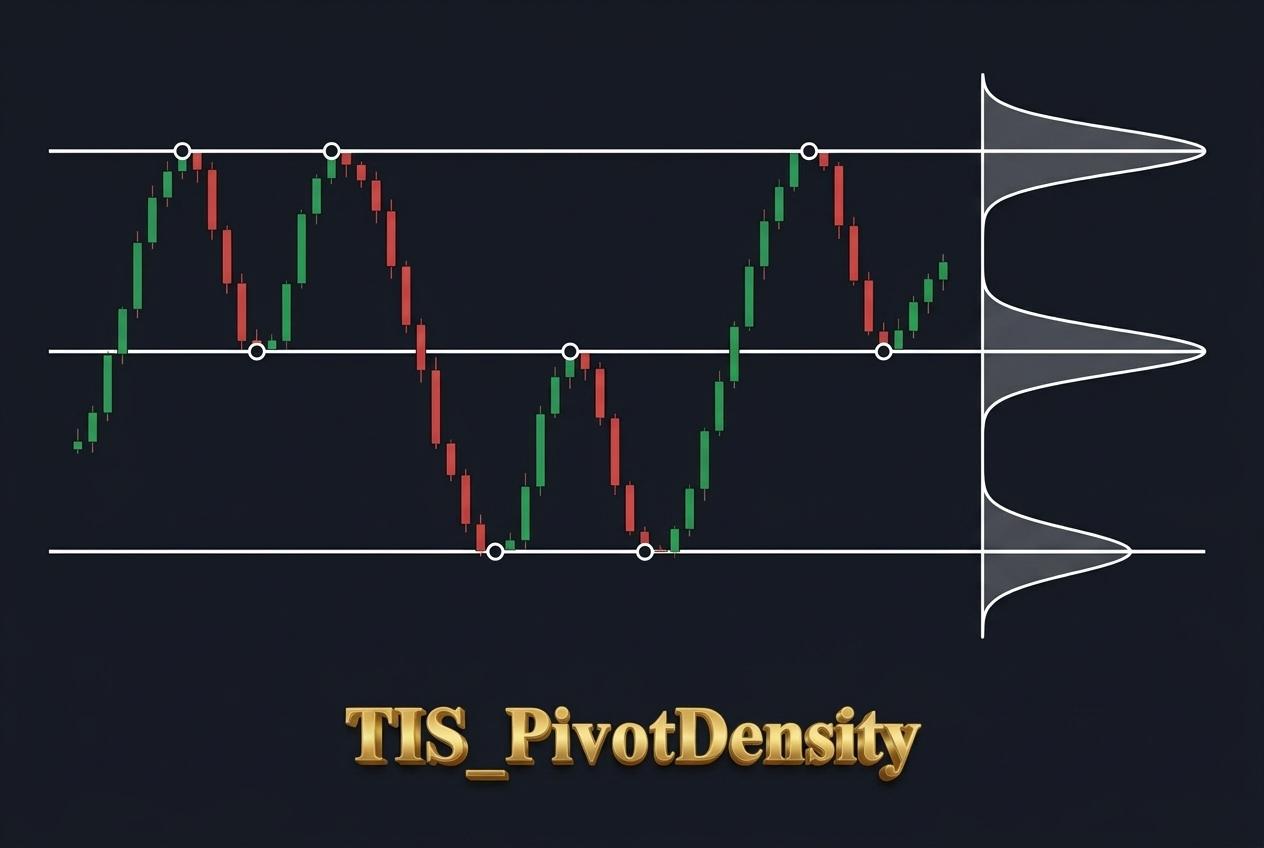
TIS_PivotDensity encuentra todos los máximos y mínimos de swing del chart, cuenta cuántos caen en cada precio y convierte ese conteo en una curva de densidad suave. Donde la curva hace un pico, traza una línea horizontal. El resultado es una lista corta de niveles donde el precio se dio vuelta una y otra vez, en lugar de una pantalla llena de líneas de cada swing.
Todos los pivots del chart
Recorre toda la historia cargada en el chart, no solo los últimos swings. Cuantos más datos cargues, más establecidos son los niveles que encuentra.
Densidad, no toques sueltos
Un swing en un precio es ruido. Diez swings alrededor del mismo precio son un nivel. El indicador pesa cada nivel según cuántos pivots lo formaron.
Una pantalla limpia
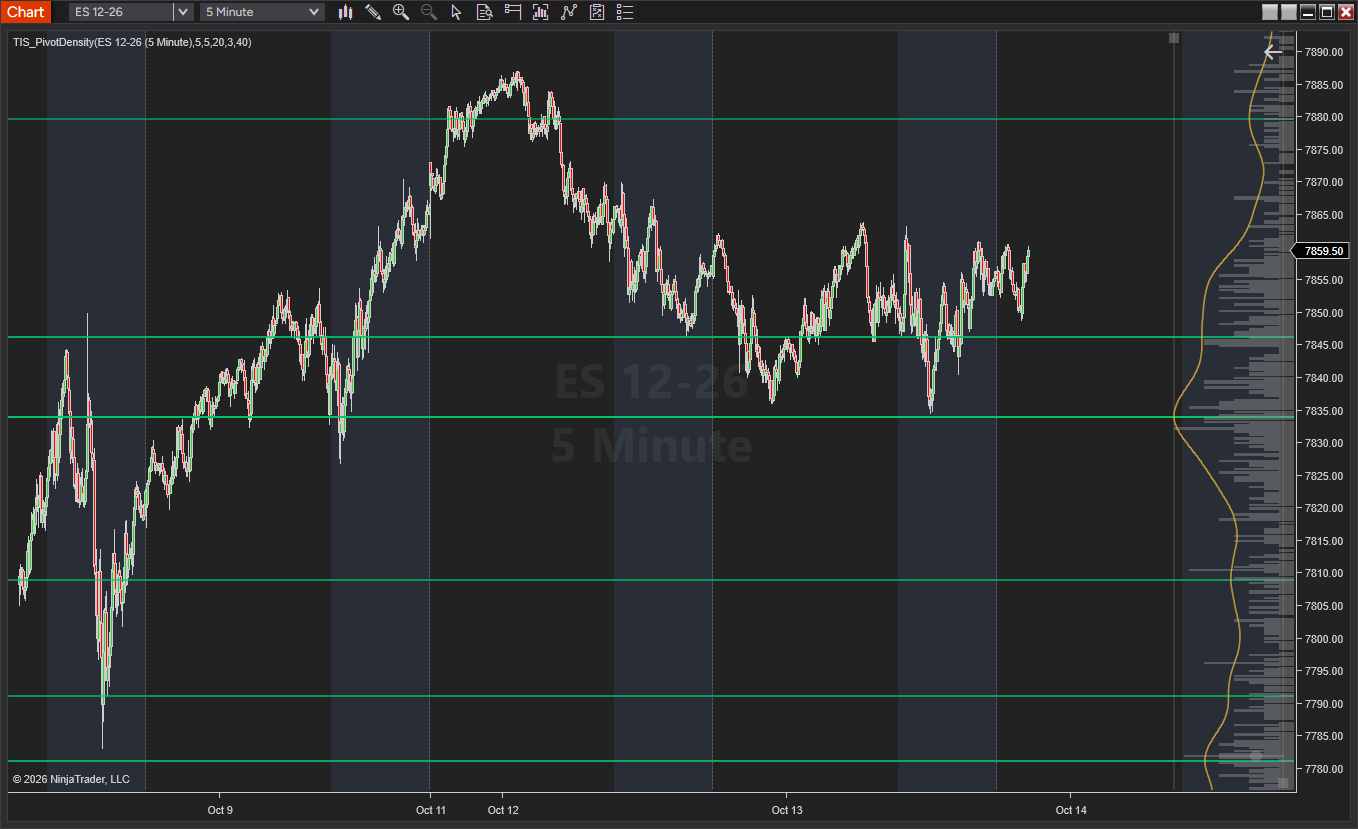
El suavizado une los pivots cercanos en una sola zona, y un umbral oculta los picos débiles. Solo ves los niveles que se destacan.
Se ajusta sobre el chart
El ancho, el umbral y el suavizado se ajustan arrastrando controles sobre el histograma. Las líneas se actualizan mientras los movés, sin abrir ningún diálogo.
Cómo funciona
Cuatro pasos, que se recalculan cada vez que se confirma un pivot nuevo.
1. Encuentra los pivots
Una barra es pivot high cuando su máximo supera a las Left_Strength barras anteriores y a las Right_Strength barras siguientes. Los pivot low funcionan igual con los mínimos. Un pivot se confirma Right_Strength barras después de formarse.
2. Cuenta pivots por precio
Los highs y los lows se suman en un histograma: cuántos pivots cayeron en cada precio, tick por tick.
3. Suaviza el conteo
El histograma crudo es irregular. Una media móvil centrada de Smooth ticks, aplicada Smooth_Passes veces, lo convierte en una curva suave. Tres pasadas se comportan como un suavizado en forma de campana y eliminan los picos falsos que deja una sola pasada.
4. Dibuja los picos
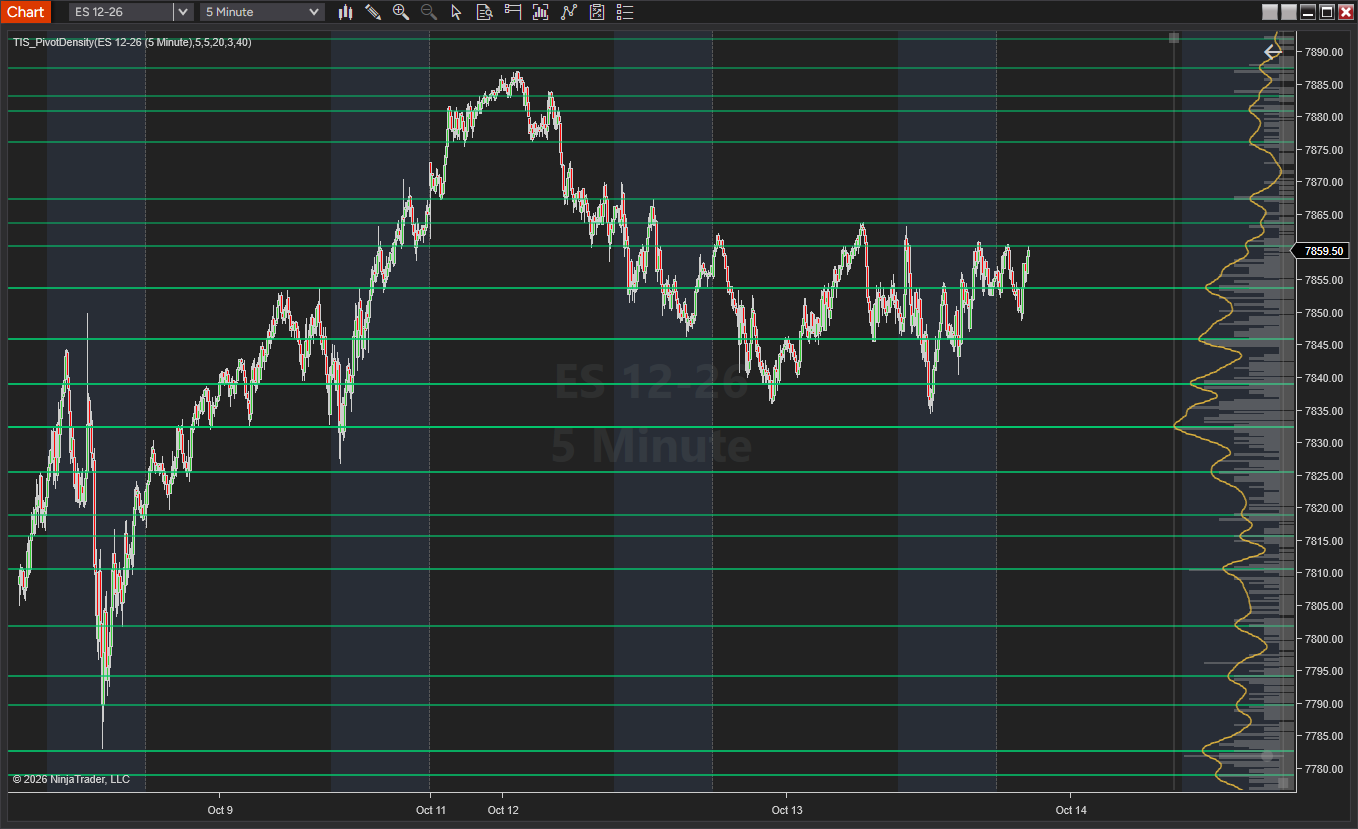
Cada pico local de la curva que llega al menos al Threshold_Pct por ciento del pico más alto se convierte en una línea horizontal. La opacidad de la línea sigue a la densidad, así los niveles más fuertes se destacan del resto.
Parámetros
Cinco valores controlan el cálculo. El resto de las opciones solo cambian cómo se ve.
| Parámetro | Por defecto | Qué controla |
|---|---|---|
| Left_Strength | 5 | Barras a la izquierda del pivot que tienen que quedar por debajo (highs) o por encima (lows). |
| Right_Strength | 5 | Barras a la derecha necesarias para confirmar un pivot. Valores más altos dan menos pivots, más significativos y confirmados más tarde. |
| Smooth | 20 | Ancho de la ventana de suavizado, en ticks de precio, no en barras. |
| Smooth_Passes | 3 | Cuántas veces se aplica el suavizado. Más pasadas dan una curva más redondeada y con menos picos. |
| Threshold_Pct | 40 | Densidad mínima, como porcentaje del pico más alto, para que un nivel se dibuje. |
Controles sobre el chart
El histograma se ubica en el borde derecho del panel de precio, con la curva de densidad encima. Tiene tres controles, y cada uno muestra su valor al pasar el mouse.
Ancho del histograma
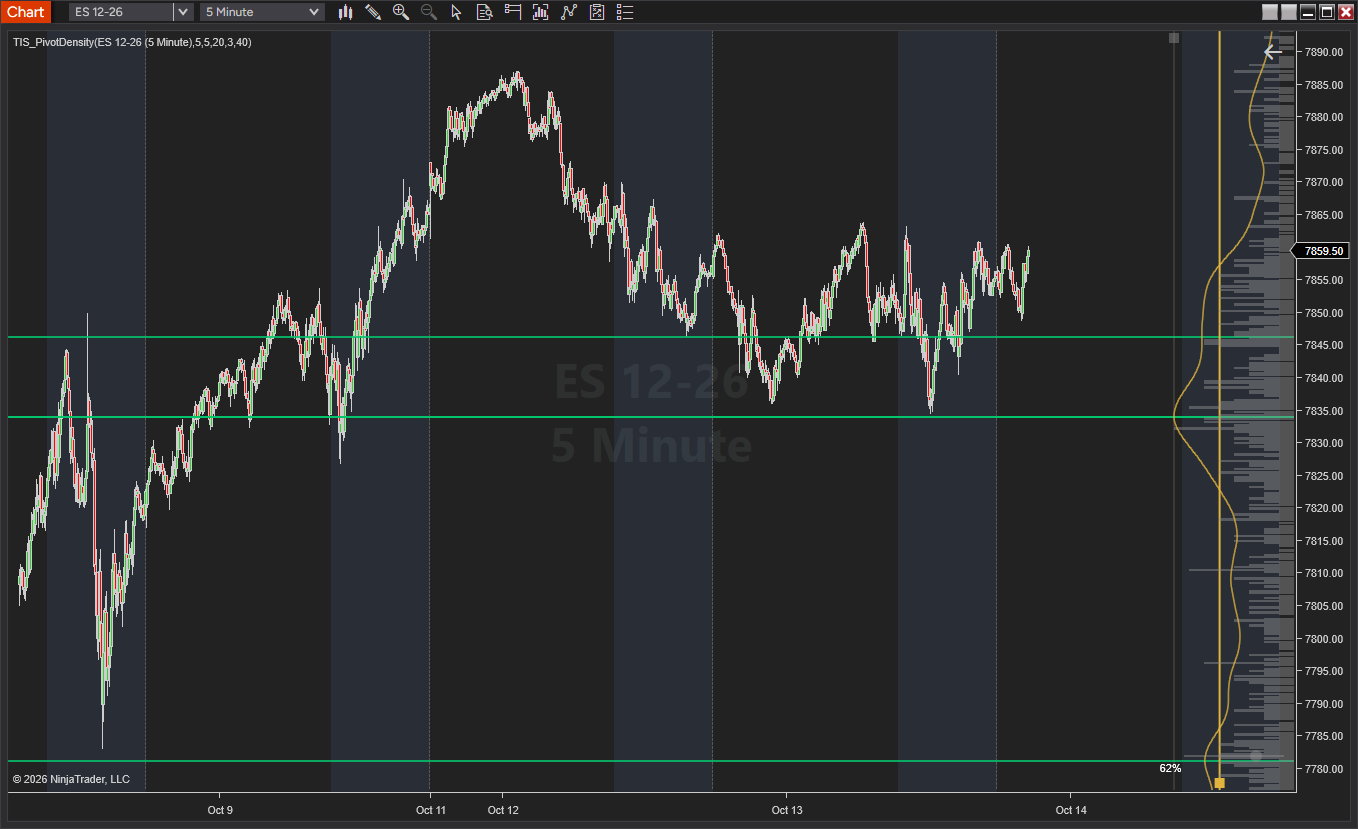
Arrastrá el borde izquierdo del histograma, con el grip arriba, para ensancharlo o angostarlo.
Umbral
Arrastrá la línea vertical del umbral, con el grip abajo. Solo los picos cuya curva la supera reciben una línea, y las líneas aparecen y desaparecen mientras la movés.
Suavizado
Un slider en la parte de abajo del histograma, en escala logarítmica de 1 a 100.000 ticks. Hacia la izquierda, más suavizado. Un click en cualquier punto de la pista salta a ese valor.
Consejos de ajuste
▪ Smooth se mide en ticks, así que el valor correcto depende del instrumento. Un mercado que cotiza al centavo, como un par cripto, necesita un valor mucho más alto que un futuro de índice para lograr el mismo suavizado.
▪ Empezá por el umbral. Si la pantalla sigue cargada, subí Smooth hasta que los niveles cercanos se unan en uno.
▪ Si dos niveles que te interesan se unen en uno solo, bajá Smooth antes de reducir Smooth_Passes.
▪ El umbral se mide contra el pico más alto de todo el histograma. Con mucha historia cargada, un nivel muy denso lejos del precio actual puede dejar por debajo del umbral a los niveles cercanos. Cargá menos historia o bajá el umbral.
Qué son las líneas, y qué no son
Cada línea marca un precio donde el mercado se dio vuelta repetidas veces en la historia cargada en el chart. Eso la convierte en una referencia de dónde fueron probables las reacciones, no en una señal ni en una predicción.
Los niveles también dependen de los datos: si cambiás el timeframe, el tipo de barra o la cantidad de historia cargada, las líneas se mueven. Un pivot necesita Right_Strength barras para confirmarse, así que los swings más recientes se suman con esa demora.
Requisitos
NinjaTrader 8. Funciona en cualquier instrumento, cualquier timeframe y cualquier tipo de barra. Se importa como cualquier otro indicador: Tools → Import → NinjaScript Add-On y elegís el ZIP tal como se descargó, sin descomprimirlo.
TIS_PivotDensity for NinjaTrader 8
The price levels where the market turned most often, found and drawn automatically.
What it does
TIS_PivotDensity finds every swing high and swing low on your chart, counts how many of them fall at each price, and turns that count into a smooth density curve. Wherever the curve peaks, it draws a horizontal line. The result is a short list of levels where price has reversed again and again, instead of a screen full of lines from every single swing.
Every pivot on the chart
It scans all the history loaded on the chart, not just the last few swings. The more data you load, the more established the levels it finds.
Density, not single touches
One swing at a price is noise. Ten swings around the same price is a level. The indicator weighs every level by how many pivots built it.
A clean screen
Smoothing merges nearby pivots into a single zone, and a threshold hides the weak peaks. You see only the levels that stand out.
Tuned on the chart itself
Width, threshold and smoothing are adjusted by dragging controls on the histogram. The lines update as you move them, with no dialog to open.
How it works
Four steps, recalculated every time a new pivot is confirmed.
1. Find the pivots
A bar is a pivot high when its high is above the Left_Strength bars before it and the Right_Strength bars after it. Pivot lows work the same way with the lows. A pivot is confirmed Right_Strength bars after it prints.
2. Count pivots by price
Highs and lows are added together into a histogram: how many pivots landed on each price, tick by tick.
3. Smooth the count
The raw histogram is spiky. A centered moving average of Smooth ticks, applied Smooth_Passes times, turns it into a smooth curve. Three passes behave like a bell-shaped smoothing and remove the false peaks a single pass leaves behind.
4. Draw the peaks
Each local peak of the curve that reaches at least Threshold_Pct percent of the highest peak becomes a horizontal line. Line opacity follows density, so the strongest levels stand out from the rest.
Parameters
Five values control the calculation. The rest of the settings only change how things look.
| Parameter | Default | What it controls |
|---|---|---|
| Left_Strength | 5 | Bars to the left of a pivot that must be lower (highs) or higher (lows). |
| Right_Strength | 5 | Bars to the right needed to confirm a pivot. Higher values mean fewer, more significant pivots, confirmed later. |
| Smooth | 20 | Width of the smoothing window, in ticks of price, not in bars. |
| Smooth_Passes | 3 | How many times the smoothing is applied. More passes give a rounder curve with fewer peaks. |
| Threshold_Pct | 40 | Minimum density, as a percentage of the highest peak, for a level to be drawn. |
On-chart controls
The histogram sits on the right edge of the price panel, with the density curve over it. Three controls live on it, and each one shows its value when you hover over it.
Histogram width
Drag the left edge of the histogram, grip at the top, to make it wider or narrower.
Threshold
Drag the vertical threshold line, grip at the bottom. Only peaks whose curve reaches past it get a line, and the lines appear and disappear as you move it.
Smoothing
A slider along the bottom of the histogram, on a logarithmic scale from 1 to 100,000 ticks. Further left means more smoothing. Click anywhere on the track to jump there.
Tuning tips
▪ Smooth is measured in ticks, so the right value depends on the instrument. A market quoted to the cent, such as a crypto pair, needs a far larger value than an index future to reach the same level of smoothing.
▪ Start with the threshold. If the screen is still busy, raise Smooth until nearby levels merge into one.
▪ If two levels you care about merge into one, lower Smooth before reducing Smooth_Passes.
▪ The threshold is measured against the highest peak of the whole histogram. With a lot of history loaded, a very dense level far from current price can push nearby levels below the threshold. Load less history or lower the threshold.
What the lines are, and what they are not
Each line marks a price where the market reversed repeatedly in the history loaded on the chart. That makes it a reference for where reactions have been likely, not a signal and not a prediction.
The levels also depend on the data: change the timeframe, the bar type or the amount of history loaded and the lines will move. A pivot needs Right_Strength bars to be confirmed, so the most recent swings are added with that delay.
Requirements
NinjaTrader 8. Works on any instrument, any timeframe and any bar type. Import it like any other indicator: Tools → Import → NinjaScript Add-On and pick the ZIP exactly as downloaded, without unzipping it.
Solo los clientes que hayan comprado este producto pueden dejar una opinión.
Opiniones
Aún no hay opiniones.