TIS_Liquidity_Levels for TradingView
This indicator is available by subscription only. Subscribe on our TradingView page →Este indicador está disponible solo por suscripción. Suscribite desde nuestra página de TradingView →
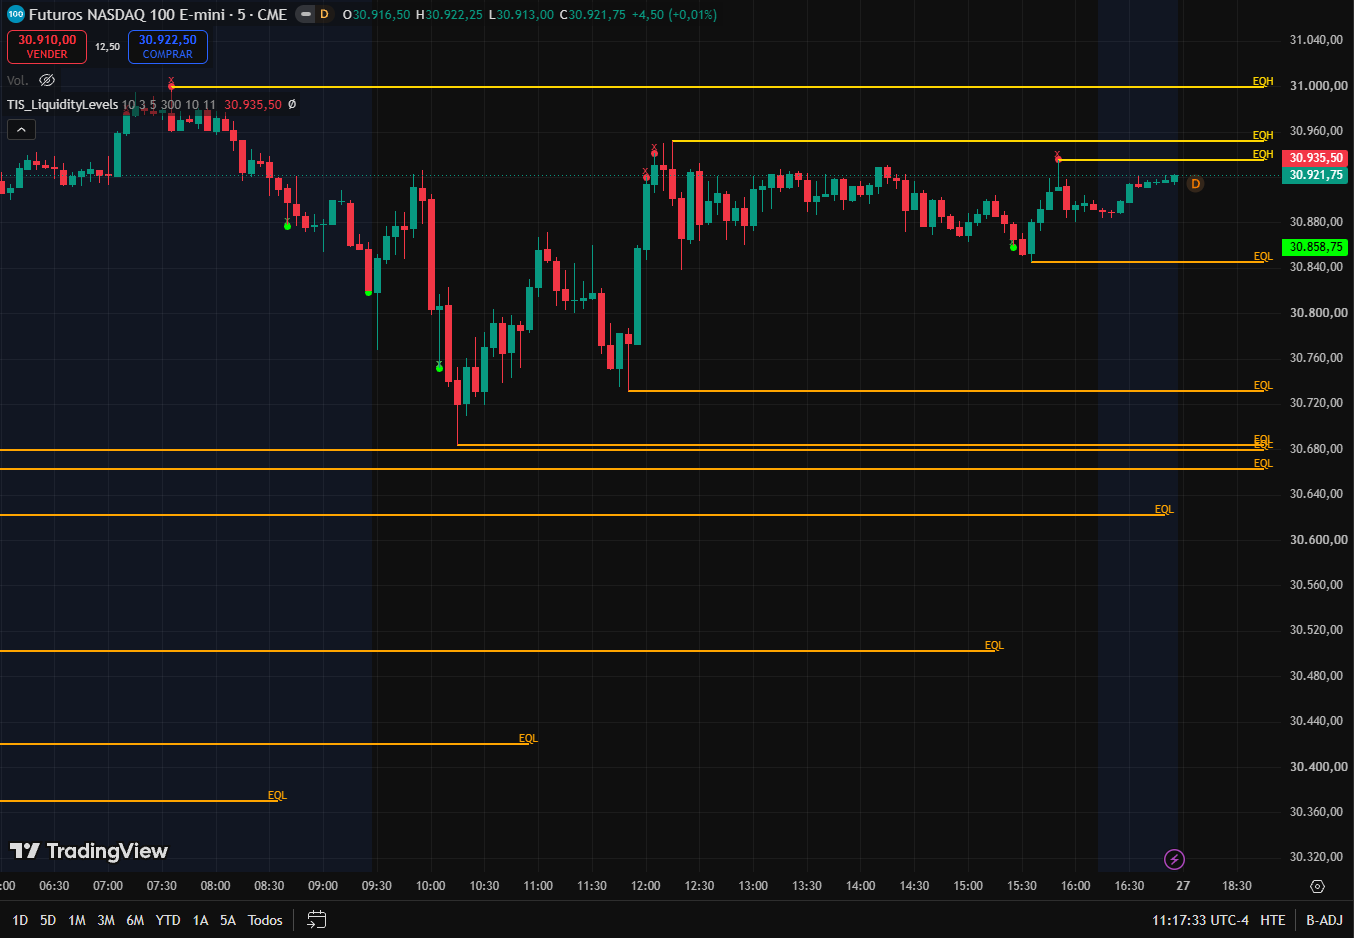
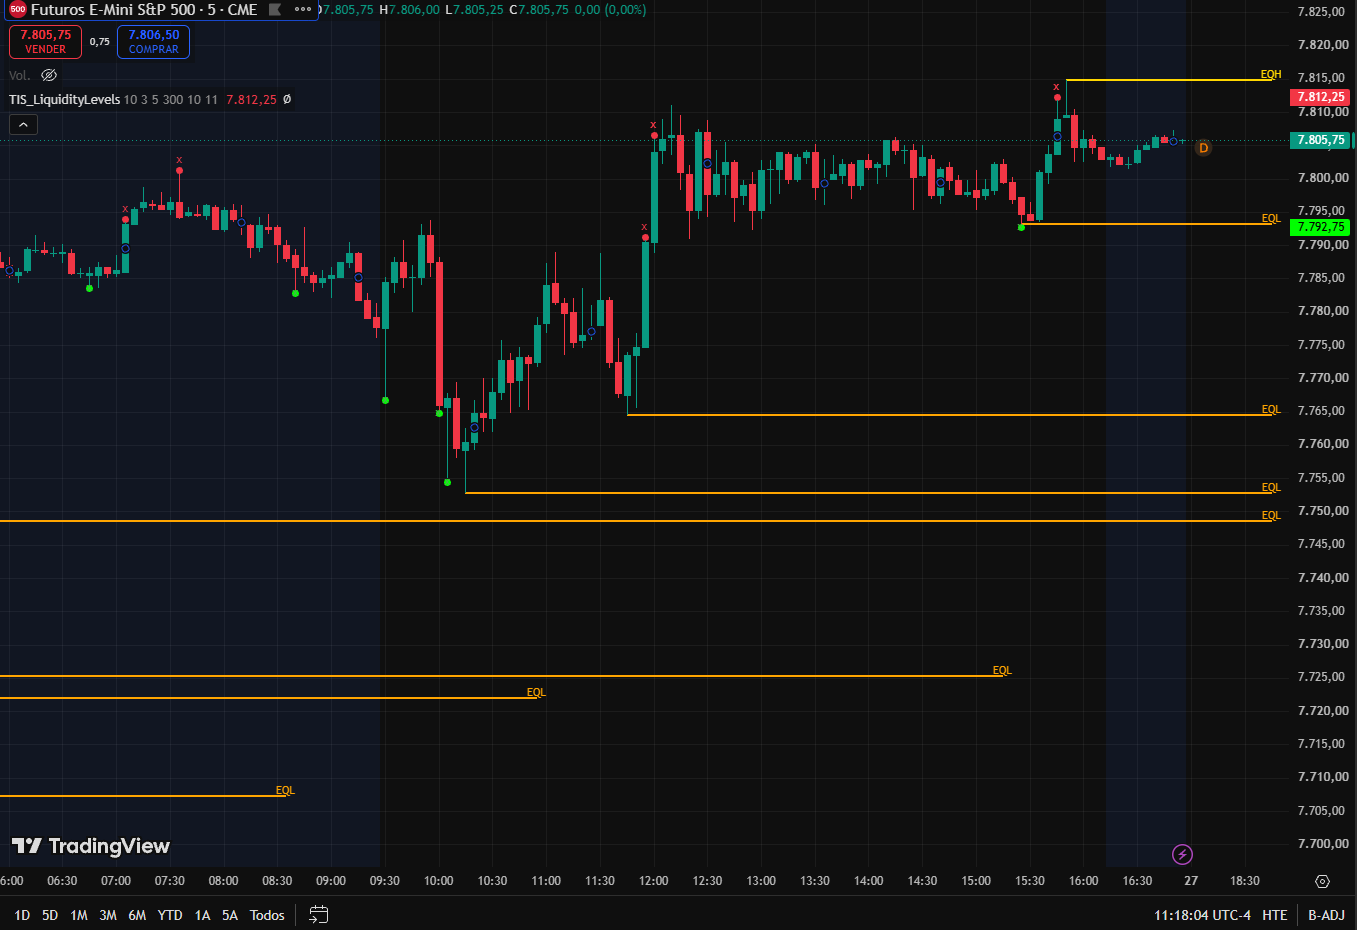
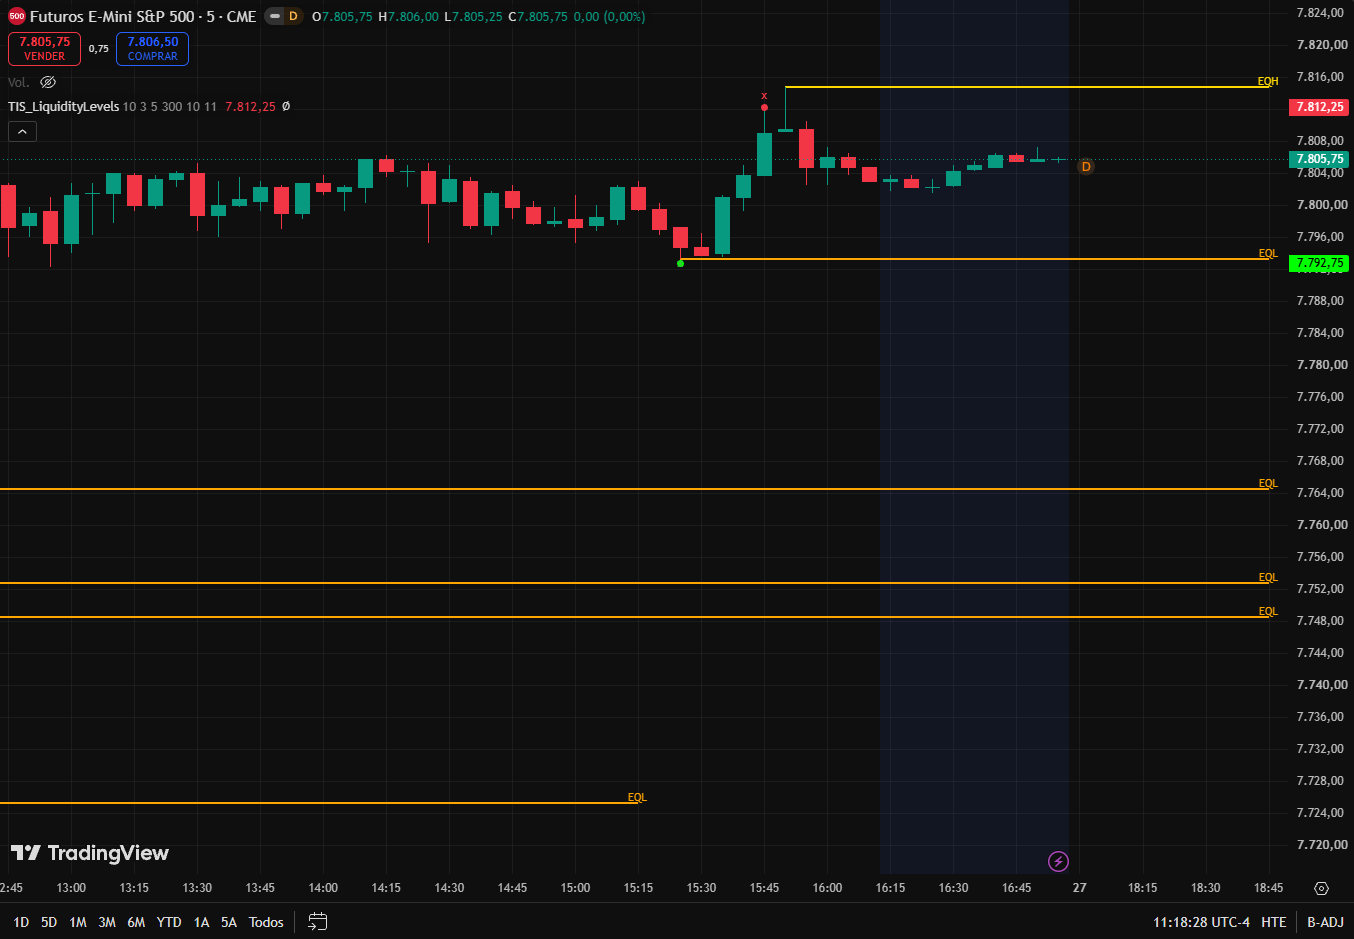
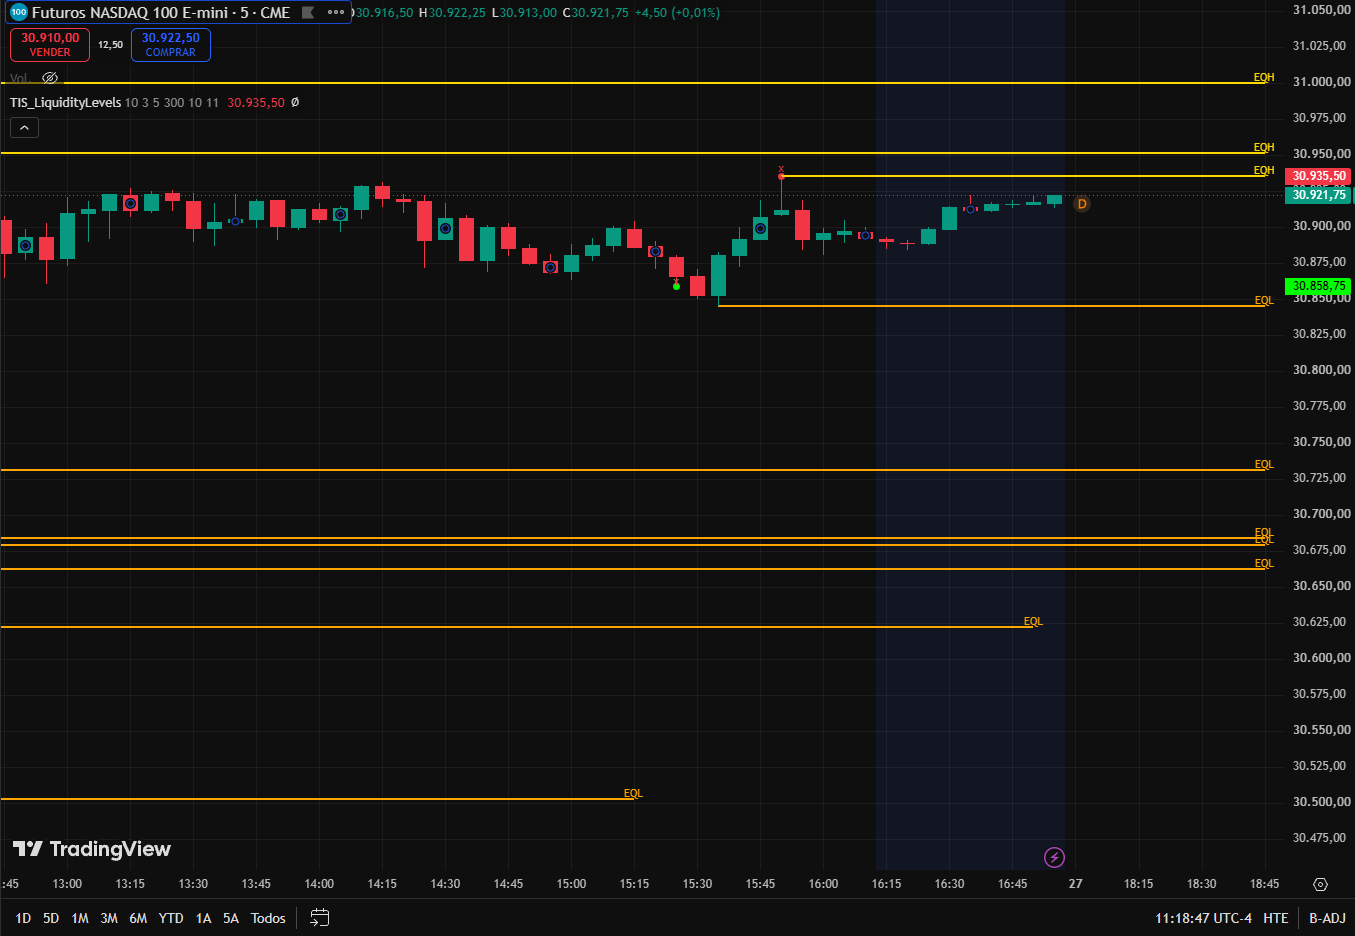
Indicador en Pine Script que detecta máximos y mínimos iguales donde se acumulan los stops, fusiona los pivotes cercanos en un solo nivel y cuenta cada toque, con $$$ en los niveles probados dos veces o más. Las señales de barrido marcan la barra exacta en que se atraviesa un nivel. Con alertas y compatible con TIS_Automator.
Pine Script indicator that detects equal highs and equal lows where stops are stacked, merges nearby pivots into a single level and counts every touch, with $$$ marking the levels tested twice or more. Sweep signals mark the exact bar a level is taken out. Alert-ready and compatible with TIS_Automator.
Description
TIS_LiquidityLevels para TradingView encuentra los lugares donde se acumulan los stops, esos máximos y mínimos iguales a los que el mercado vuelve una y otra vez, y después te avisa en qué barra exacta se lleva uno puesto.
Cómo funciona
Cada swing alto y cada swing bajo confirmado se convierte en un nivel candidato. Lo que lo transforma en un nivel de liquidez y no en un pivote más es lo que pasa después: cuando se forma otro pivote aproximadamente al mismo precio, dentro de una tolerancia que definís en ticks, los dos se tratan como un mismo nivel en lugar de como dos líneas separadas. El nivel absorbe al pivote nuevo, se ajusta a su precio y lo cuenta como un toque más.
Ese conteo de toques es el punto central. Un máximo que el mercado rechazó una vez es un pivote. Un máximo que el mercado rechazó tres veces distintas es un escalón con órdenes apoyadas encima, y la etiqueta lo dice: el nivel queda marcado con cuántas veces fue tocado, y con $$$ a partir del segundo toque. La línea se proyecta hacia adelante, más allá de la barra actual, así el nivel queda delante del precio y no detrás.
Después viene la parte que estabas esperando. Cuando el precio finalmente atraviesa un nivel, el indicador marca esa barra con una x, pinta la línea de gris para dejar registrado que la liquidez ya se consumió, y publica una señal de barrido de ese lado. La línea gris se queda en el gráfico la cantidad de barras que elijas y después se borra sola, así el gráfico conserva solo los niveles que siguen importando.
La definición del pivote es deliberadamente asimétrica. El lado izquierdo es estricto, o sea que un nivel tiene que destacarse contra un tramo largo de historial para calificar, mientras que el derecho es corto, así se confirma rápido en lugar de aparecer diez barras tarde. Los dos lados los definís vos.
Características principales
▸ Máximos y mínimos iguales detectados automáticamente, agrupados por una tolerancia que definís en ticks
▸ Los pivotes cercanos se fusionan en un solo nivel en vez de llenar el gráfico de líneas paralelas
▸ Conteo de toques impreso en cada nivel, con $$$ en los que fueron probados dos veces o más
▸ Fuerza de pivote asimétrica: estricta a la izquierda por calidad, corta a la derecha por velocidad
▸ Los niveles se proyectan más allá de la barra actual, así la liquidez queda delante del precio
▸ Detección de barrido: marca la barra exacta en que el nivel es atravesado
▸ Los niveles barridos pasan a gris y se borran solos después de una cantidad configurable de barras
▸ Salidas de barrido separadas para el lado alto y el bajo, seleccionables como fuente por otros scripts
▸ Alertas para los dos lados
Parámetros
| Parámetro | Descripción |
|---|---|
| Pivot Strength Left | Barras previas al pivote que tiene que superar. Valores más altos dan menos niveles y más significativos. |
| Pivot Strength Right | Barras posteriores necesarias para confirmarlo. Es lo que tarda el nivel en aparecer, así que mantenerlo corto mantiene al indicador reactivo. |
| Equality Tolerance (Ticks) | Diferencia máxima para considerar dos niveles iguales. Una tolerancia amplia fusiona más pivotes en un mismo escalón; una estrecha exige una coincidencia más limpia. |
| Max Lookback Bars | Hasta dónde mirar hacia atrás para buscar máximos y mínimos coincidentes. Los niveles más viejos que eso dejan de seguirse. |
| Swept Line Visible Bars | Cuánto se conserva la línea después de ser quebrada, para ver qué se acaba de llevar el precio sin que el gráfico se llene de niveles muertos. |
| Text Font Size | Tamaño de las etiquetas de los niveles y de las marcas de barrido. |
¿Para quién es?
Para el trader que trabaja con una lectura del mercado basada en liquidez y quiere los escalones marcados de forma mecánica en lugar de dibujados a mano y discutidos después. El conteo de toques hace el ranking por vos, así no tratás igual a un nivel probado una vez que a uno probado cuatro. Y como el barrido se publica como señal y no solo como dibujo, puede alimentar lo que hagas a continuación: una entrada de reversión una vez limpiados los stops, o simplemente una alerta para estar frente a la pantalla cuando ocurra.
Listo para automatizar. TIS_LiquidityLevels es totalmente compatible con nuestro sistema TIS_Automator: seleccionás las salidas de barrido alto y bajo como fuentes de señal, definís target y stop, y las tomas de liquidez se operan de punta a punta sin intervención manual.
TIS_LiquidityLevels for TradingView finds the places where stops are stacked, the equal highs and equal lows the market keeps coming back to, and then tells you the exact bar one of them gets taken out.
How It Works
Every confirmed swing high and swing low becomes a candidate level. What makes it a liquidity level rather than just a pivot is what happens next: when another pivot forms at roughly the same price, within a tolerance you set in ticks, the two are treated as the same level instead of as two separate lines. The level absorbs the new pivot, adjusts to its price, and counts it as another touch.
That touch count is the whole point. A high that the market rejected once is a pivot. A high the market has refused three separate times is a shelf with orders sitting above it, and the label says so: the level is tagged with how many times it has been hit, and marked with $$$ from the second touch onward. The line projects forward past the current bar, so the level is in front of price rather than behind it.
Then comes the part you are actually waiting for. When price finally trades through a level, the indicator marks that bar with an x, turns the line gray to record that the liquidity is gone, and publishes a sweep signal on that side. The gray line stays on the chart for a number of bars you choose and then clears itself, so the chart keeps only the levels that still matter.
The pivot definition is deliberately asymmetric. The left side is strict, so a level has to stand out against a long stretch of history to qualify, while the right side is short, so it gets confirmed quickly instead of appearing ten bars late. Both sides are yours to set.
Key Features
▸ Equal highs and equal lows detected automatically, grouped by a tolerance you set in ticks
▸ Nearby pivots merge into one level instead of cluttering the chart with parallel lines
▸ Touch count printed on every level, with $$$ marking the ones tested twice or more
▸ Asymmetric pivot strength: strict on the left for quality, short on the right for speed
▸ Levels project ahead of the current bar, so the liquidity is in front of price
▸ Sweep detection marks the exact bar a level is taken out
▸ Swept levels turn gray and clear themselves after a configurable number of bars
▸ Separate sweep outputs for the high side and the low side, selectable as sources by other scripts
▸ Alert conditions for both sides
Parameters
| Parameter | Description |
|---|---|
| Pivot Strength Left | Bars before the pivot it has to clear. Higher values mean fewer and more significant levels. |
| Pivot Strength Right | Bars after the pivot needed to confirm it. This is how many bars the level takes to appear, so keeping it short keeps the indicator responsive. |
| Equality Tolerance (Ticks) | Max difference to consider levels equal. Wider tolerance merges more pivots into a single shelf; tighter tolerance demands a cleaner match. |
| Max Lookback Bars | How far back to check for matching highs and lows. Levels older than this stop being tracked. |
| Swept Line Visible Bars | How long to keep the line after it is broken, so you can see what was just taken out without the chart filling up with dead levels. |
| Text Font Size | Size of the level labels and of the sweep marks. |
Who Is It For?
Traders working with a liquidity based read of the market who want the shelves marked mechanically instead of drawn by hand and argued about afterwards. The touch count does the ranking for you, so you are not treating a level tested once the same as one tested four times. And because the sweep is published as a signal rather than just a drawing, it can feed whatever you do next: a reversal entry after the stops are cleared, or simply an alert so you are at the screen when it happens.
Automation ready. TIS_LiquidityLevels is fully compatible with our TIS_Automator system: select the high sweep and low sweep outputs as signal sources, set your target and stop, and the liquidity grabs can be traded end to end without manual intervention.
Solo los clientes que hayan comprado este producto pueden dejar una opinión.
Related Products
-
-
-


-
Sale
¡Oferta!
Opiniones
Aún no hay opiniones.